Abstract
Natural ventilation is the main passive strategy for thermal comfort inside buildings and renewal of the air, making it healthier. In recent decades, Computational Fluid Dynamics has proven to be an efficient tool for estimating natural ventilation. The objective of this work was to study the ventilation from the action of the wind inside models of low-rise buildings to observe how geometric conditions influence the topology of the flow and volume flow ratesusing the open source software OpenFOAM. In order to verify and validate the software, a 3D building model with openings on opposite faces was used. Subsequently, arrays of three buildings were studied albeit considering the problem as two-dimensional. In the arrangements, three different terrain slopes and four distance values between buildings were tested. The results show that ventilation in the second and third buildings was gradually recovered with an increase in separation and terrain slope, although the values obtained in the first building were not reached.
Keywords:
Wind-driven ventilation; CFD; OpenFOAM; Numerical simulation; Low-rise buildings
Resumo
A ventilação natural é a principal estratégia passiva para a obtenção do conforto térmico no interior das edificações, além de promover a renovação do ar ambiente, tornando-o mais saudável. Nas últimas décadas, a Dinâmica dos Fluidos Computacional mostrou-se uma ferramenta eficiente para estimar a ventilação natural. Diante disso, o objetivo do presente trabalho é estudar, através do software livre de código aberto OpenFOAM, a ventilação promovida pela ação do vento no interior de modelos de edificações de pequena altura, observando como as condições geométricas influenciam a topologia do escoamento e as taxas de fluxo volumétrico. Para a verificação e validação do software emprega-se um modelo 3D de edificação com aberturas em faces opostas. Posteriormente, são estudados arranjos de três edificações, contudo, considerando o problema como bidimensional. Nos arranjos, testam-se três diferentes inclinações de terreno e quatro valores de afastamento entre as edificações. Os resultados mostram que a ventilação na segunda e terceira edificação é gradativamente recuperada com o aumento dos afastamentos e da inclinação do terreno, embora, não se atinge os valores obtidos na primeira edificação.
Palavras-chave:
Ventilação cruzada; CFD; OpenFOAM; Simulação numérica; Edificações baixas
Introduction
The growing population in urban areas has created the need to evaluate the conditions of environments that provide better natural ventilation. The main goal of ventilating buildings is to renew the air, making the environments more comfortable and healthy. Until now, designers of buildings rarely take into account the effect that the ventilation of indoor environments can haveon the occupants such as thermal discomfort, health problems such as respiratory and skin diseases (AMORES et al., 2019AMORES, C. P. et al. Natural ventilation analysis in an underground construction: CFD simulation and experimental validation. Tunnelling and Underground Space Technology, v. 90, p. 162-173, 2019.; VERVOORT; BLOCKEN; HOOFF, 2019VERVOORT, R.; BLOCKEN, B.; HOOFF, T. V. Reduction of particulate matter concentrations by local removal in a building courtyard: Case study for the Delhi American Embassy School. Science of The Total Environment, v. 686, p. 657-680, 2019.). Currently, due to the COVID-19 pandemic, natural ventilation is cited as one of the main protocols (EUROPEAN…, 2020EUROPEAN CENTRE FOR DISEASE PREVENTION AND CONTROL. Heating, ventilation and air-conditioning systems in the context of COVID-19. European Union, 2020.; MORAWSKA; MILTON, 2020MORAWSKA, L.; MILTON, D. K. It Is Time to address airborne transmission of coronavirus disease 2019 (COVID-19). Clinical Infectious Diseases, v. 71, n. 9, p. 2311-2313, 2020.; REN et al., 2021REN, J. et al. Numerical study of three ventilation strategies in a prefabricated COVID-19 inpatient ward. Building and Environment , v. 188, n. 4, p. 1-17, 2021.) necessary to prevent the transmission of the virus.
Another important point to highlight is energy consumption, mostly associated with the use of mechanical ventilation and air conditioners. In 2017, air conditioners became the fourth biggest consumer of electricity in Brazilian households, responsible for approximately 14% of total consumption (EMPRESA…, 2018EMPRESA DE PESQUISA ENERGÉTICA. Nota Técnica EPE 030/2018: uso de ar condicionado no setor residencial brasileiro. Rio de Janeiro, 2018.). In hot climate regions, the construction of naturally ventilated buildings can therefore result in significantly lower energy consumption (CAO; DAI; LIU, 2016CAO, X.; DAI, X.; LIU, J. Building energy-consumption status worldwide and the state-of-the-art technologies for zero-energy buildings during the past decade. Energy and Buildings, v. 128, p. 198-213, 2016.).
Natural ventilation is one of the main ways to obtain thermal comfort. It reduces energy consumption in artificial conditioning (mechanical ventilation and/or air conditioning) and promotes a healthier internal environment.
Most structures built for residential, commercial and other purposes around the world can be classified as low-rise buildings (UEMATSU; ISYUMOV, 1999UEMATSU, Y.; ISYUMOV, N. Wind pressures acting on low-rise buildings. Journal of Wind Engineering and Industrial Aerodynamics , v. 82, p. 1-25, 1999.). As a result, modeling and simulating natural ventilation in low-rise building models is of fundamental importance.
Among the means to study natural ventilation there are numerical simulation programs based on Computational Fluid Dynamics (CFD). Ventilation simulation can evaluate the performance of the building that are still in the design phase, assisting in the decision making along the way. Different geometric models from the simplest to the most complexcan be studied and various conditions of flow velocity, temperature, pressure, among other variablescan be evaluated. The results can be obtained accurately and quickly enabling new changes to be made promptly reducing project delays. It is worth mentioning that compared to wind tunnel tests, numerical simulation is quicker and more economical, despite being highly dependent on user decisions (grid, initial and boundary conditions, numerical schemes, solvers, tolerances) and demanding mainly computational resources (RAMPONI; BLOCKEN, 2012RAMPONI, R.; BLOCKEN, B. CFD simulation of cross-ventilation for a generic isolated building: impact of computational parameters. Building and Environment , v. 53, p. 34-48, 2012.; BLOCKEN; STATHOPOULOS; BEECK, 2016BLOCKEN, B.; STATHOPOULOS, T.; BEECK, J. P. A. J. V. Pedestrian-level wind conditions around buildings: review of wind-tunnel and CFD techniques and their accuracy for wind comfort assessment. Building and Environment , v. 100, p. 50-81, 2016.).
CFD mainly deals with Navier-Stokes equations used to describe fluid flow (VERSTEEG; MALALASEKERA, 2007VERSTEEG, H. K.; MALALASEKERA, W. An introduction to computational fluid dynamics: the finite volume method. Essex: Pearson Prentice Hall, 2007.). Several works, such as those carried out by Kosutova et al. (2019KOSUTOVA, K. et al. Cross ventilation in a generic isolated building equipped with louvers: Wind-tunnel experiments and CFD simulations. Building and Environment , v. 154, p. 263-280, 2019.), Liu et al. (2019LIU, S. et al. CFD simulations of natural cross ventilation through an apartment with modified hourly wind information from a meteorological station. Energy and Buildings , v. 195, p. 16-25, 2019.) and Varela-Boydo and Moya (2020)VARELA-BOYDO, C. A.; MOYA, S. L. Inlet extensions for wind towers to improve natural ventilation in buildings. Sustainable Cities and Society, v. 53, p. 1-11, 2020. show the potential and level of maturity that CFD presents for solving complex problems.
In Brazil, although the use of CFD for ventilation analysis in buildings is relatively new, important studies have already been conducted using several pieces of commercial software such as CFX, Fluent and Phoenics. For example, there are works regarding the ventilation in models of prefabricated buildings (TRINDADE; PEDRINI; DUARTE, 2010TRINDADE, S. C.; PEDRINI, A.; DUARTE, R. N. C. Métodos de aplicação da simulação computacional em edifícios naturalmente ventilados no clima quente e úmido. Ambiente Construído , Porto Alegre, v. 10, n. 4, p. 37-58, out./dez. 2010.), calculation of external pressure coefficients in a building (CÓSTOLA; ALUCCI, 2011CÓSTOLA, D.; ALUCCI, M. P. Aplicação de CFD para o cálculo de coeficientes de pressão externos nas aberturas de um edifício. Ambiente Construído, Porto Alegre, v. 11, n. 1, p. 145-158, jan./mar. 2011.), to determine how horizontal densification and the reduction of distances between buildings affect ventilation (TORK; TIBIRIÇÁ; TIBIRIÇÁ, 2017TORK, L. D. A.; TIBIRIÇÁ, A. C. G.; TIBIRIÇÁ, A. M. B. Análise da ventilação natural conforme planos diretores: resultados de pesquisa em Belém, PA. Ambiente Construído , Porto Alegre, v. 17, n. 1, p. 339-351, jan./mar. 2017.), efficiency of ventilation in different models of multifamily buildings of the Program Minha Casa, Minha Vida (MORAIS; LABAKI, 2017MORAIS, J. M. S. C.; LABAKI, L. C. CFD como ferramenta para simular ventilação natural interna por ação dos ventos: estudos de caso em tipologias verticais do “Programa Minha Casa, Minha Vida”. Ambiente Construído , Porto Alegre, v. 17, n. 1, p. 223-244, jan./mar. 2017.), to observe the influence of sheds on the roof of buildings (LUKIANTCHUKI et al., 2018LUKIANTCHUKI, M. A. et al. Influência do número de sheds e da distância horizontal entre eles no desempenho da ventilação natural. Ambiente Construído , Porto Alegre, v. 18, n. 2, p. 161-176, abr./jun. 2018.), as well as to study the natural ventilation in office building retrofitting in a dense urban context (FONTENELLE; BASTOS; LORENTE, 2021FONTENELLE, M. R.; BASTOS, L. E. G.; LORENTE, S. Natural ventilation for office building retrofit in dense urban context under hot and humid climate. Ambiente Construído, Porto Alegre, v. 21, n. 2, p. 67-87, abr./jun. 2021.), among others.
Commercial CFD software has been widely used to provide optimal results with intuitive interfaces for users. However, associated with the use of these tools, there is the cost of licenses and less freedom for customization and implementation because their source codes are inaccessible (HONG et al., 2017HONG, S. W. et al. Validation of an open source CFD code to simulate natural ventilation for agricultural buildings. Computers and Electronics in Agriculture, v. 138, p. 80-91, 2017.). On the other hand, Open CFD packages tend to be less intuitive and have less explanatory documentation but can be used and modified freely. This is the case of OpenFOAM (The OpenFOAM Foundation), which has recently gained space in the studies of various industrial and academic problems. Furthermore, its reliability has already been proven in studies from different areas, for example, in natural ventilation, Almeida, Araújo and Almeida (2018)ALMEIDA, M. S.; ARAÚJO, A. D.; ALMEIDA, M. P. Tall building influence on city wind pattern. International Journal of Modern Physics C, v. 29, n. 10, p. 1-20, 2018., Badas et al. (2017)BADAS, M. G. et al. On the effect of gable roof on natural ventilation in two-dimensional urban canyons. Journal of Wind Engineering and Industrial Aerodynamics, v. 162, p. 24-34, 2017., Naboni et al. (2019)NABONI, E. et al. A digital workflow to quantify regenerative urban design in the context of a changing climate. Renewable and Sustainable Energy Reviews, v. 113, p. 109255, 2019., Sen and Roesler (2020)SEN, S; ROESLER, J. Wind direction and cool surface strategies on microscale urban heat island. Urban Climate, v. 31, p. 1-15, 2020., in petroleum, Cheng et al. (2018)CHENG, J. et al. CFD-PBE simulation of a bubble column in OpenFOAM. Chinese Journal of Chemical Engineering, v. 26, n. 9, p. 1773-1784, 2018., Yi et al. (2021)YI, P. et al. Experimental and numerical investigation of low sulfur heavy fuel oil spray characteristics under high temperature and pressure conditions. Fuel, v. 286, part 2, p. 1-16, 2021. and Pugliese, Ettehadtavakkol and Panacharoensawad (2021)PUGLIESE, V.; ETTEHADTAVAKKOL, A.; PANACHAROENSAWAD, E. Drift flux model parameters estimation based on numerical simulation of slug flow regime with high-viscous liquids in pipelines. International Journal of Multiphase Flow, v. 135, p. 1-55, 2021., in aerodynamics, He et al. (2018)HE, P. et al. An aerodynamic design optimization framework using a discrete adjoint approach with OpenFOAM. Computers & Fluids, v. 168, p. 285-303, 2018., Zhang, Deng and Wang (2019)ZHANG, Y.; DENG, S.; WANG, X. RANS and DDES simulations of a horizontal-axis wind turbine under stalled flow condition using OpenFOAM. Energy, v. 167, p. 1155-1163, 2019., Amini et al. (2021)AMINI, S. et al. Numerical simulation of the Mexico wind turbine using the actuator disk model along with the 3D correction of aerodynamic coefficients in OpenFOAM. Renewable Energy , v. 163, p. 2029-2036, 2021., among others.
The geometric aspects of the building or the environment influence natural ventilation (ALLARD; GHIAUS, 2005ALLARD, F.; GHIAUS, C. Natural ventilation in the urban environment: assessment and design. London: Routledge, 2005.; TOMINAGA; BLOCKEN, 2015TOMINAGA, Y.; BLOCKEN, B. Wind tunnel experiments on cross-ventilation flow of a generic building with contaminant dispersion in unsheltered and sheltered conditions. Building and Environment , v. 92, p. 452-461, 2015.; AI; MAK, 2018AI, Z. T.; MAK, C. M. Wind-induced single-sided natural ventilation in buildings near a long street canyon: CFD evaluation of street configuration and envelope design. Journal of Wind Engineering & Industrial Aerodynamics, v. 172, p. 96-106, 2018.; ARINAMI et al., 2019ARINAMI, Y. et al. Performance evaluation of single-sided natural ventilation for generic building using large-eddy simulations: Effect of guide vanes and adjacent obstacles. Building and Environment, v. 154, p. 68-80, 2019.; GHADIKOLAEI; OSSEN; MOHAMED, 2020GHADIKOLAEI, F. M.; OSSEN, D. R.; MOHAMED, M. F. Effects of wing wall at the balcony on the natural ventilation performance in medium-rise residential buildings. Journal of Building Engineering, v. 31, p. 1-14, 2020.). Simple aspects, such as roof geometry, window position, wind direction, height of buildings and urban configuration significantly affect ventilation (ABOHELA; HAMZA; DUDEK, 2013ABOHELA, I.; HAMZA, N.; DUDEK, S. Effect of roof shape, wind direction, building height and urban configuration on the energy yield and positioning of roof mounted wind turbines. Renewable Energy, v. 50, p. 1106-1118, 2013.; PERÉN et al., 2015PERÉN, J. I. et al. CFD analysis of cross-ventilation of a generic isolated building with asymmetric opening positions: Impact of roof angle and opening location. Building and Environment , v. 85, p. 263-276, 2015.).
The present work aims to study how the terrain slope and separation between buildings can interfere in the natural ventilation promoted by the action of the wind in arrangements of three models of low-rise buildingsusing open source software OpenFOAM.
It should be highlighted that there are already studies on natural ventilation, in which building arrangements were tested so as to capture the interference of one building on another (CHEUNG; LIU, 2011CHEUNG, J. O. P.; LIU, C. H. CFD simulations of natural ventilation behaviour in high-rise buildings in regular and staggered arrangements at various spacings. Energy and Buildings , v. 43, p. 1149-1158, 2011.; BADAS et al., 2017BADAS, M. G. et al. On the effect of gable roof on natural ventilation in two-dimensional urban canyons. Journal of Wind Engineering and Industrial Aerodynamics, v. 162, p. 24-34, 2017.; KING et al., 2017KING, M. F. et al. Investigating the influence of neighbouring structures on natural ventilation potential of a full-scale cubical building using time-dependent CFD. Journal of Wind Engineering and Industrial Aerodynamics , v. 169, p. 265-279, 2017.; WU; DOU; CHEN, 2019WU, Z.; DOU, P.; CHEN, L. Comparative and combinative cooling effects of different spatial arrangements of buildings and trees on microclimate. Sustainable Cities and Society , v. 51, p. 1-32, 2019.; GUPTA; KHARE, 2021GUPTA, D.; KHARE, V. R. Natural ventilation design: predicted and measured performance of a hostel building in composite climate of India. Energy and Built Environment, v. 2, n. 1, p. 82-93, 2021.), however, no studies were found that analyze building arrangements in which the distance between the buildings and the terrain slope vary.
In the first section of this paperthe schemes and boundary conditions chosen in OpenFOAM to simulate the flow in a 3D building model with openings on opposite faces (HOOFF; BLOCKEN; TOMINAGA, 2017HOOFF, T. V.; BLOCKEN, B.; TOMINAGA, Y. On the accuracy of CFD simulations of cross-ventilation flows for a generic isolated building: Comparison of RANS, LES and experiments. Building and Environment , v. 114, p. 148-165, 2017.), analyzing airflow, velocity profiles and turbulent kinetic energy are presented. Later, using the building model in the previous case, arrangements of three buildings in series were studied, considering the problem in two dimensions (2D). The arrangements of three buildings were tested using three different terrain slopes and four separations between the buildings. The following section addresses the analysis of results obtained with the open source CFD software package OpenFOAM. Finally, the last section contains several concluding remarks.
Method
Initially, a three-dimensional case of natural ventilation was used to validate the numerical simulation predicted with the OpenFOAM software. The distributions of the dimensionless mean x-velocity for the four grids and volume flow rate predicted were compared to numerical and experimental results.
The evaluation of the ventilation performance is an important part of wind-driven natural ventilation studies. A volume flow rate, used by many researchers (NGUYEN; REITER, 2011NGUYEN, A. T.; REITER, S. The effect of ceiling configurations on indoor air motion and ventilation flow rates. Building and Environment , v. 46, p. 1211-1222, 2011.; LARSEN et al., 2011LARSEN, T. S. et al. Characterization and prediction of the volume flow rate aerating a cross ventilated building by means of experimental techniques and numerical approaches. Energy and Buildings , v. 43, n. 6, p. 1371-1381, 2011.; ZHANG; WEERASURIYA; TSE, 2020ZHANG, X.; WEERASURIYA, A. U.; TSE, K. T. CFD simulation of natural ventilation of a generic building in various incident wind directions: comparison of turbulence modelling, evaluation methods, and ventilation mechanisms. Energy and Buildings , v. 229, p. 1-57, 2020.), was used here as the ventilation performance parameter to evaluate the natural ventilation performance in buildings. The volume flow rate was made dimensionless using the velocity at building height (u 0 ) and the window area (Aopen). The turbulence model used estimates the distribution of turbulent kinetic energy (k), therefore, it is recommended for the study of a 3D case. This variable has also been used in various studies in the area, such as Ramponi and Blocken (2012)RAMPONI, R.; BLOCKEN, B. CFD simulation of cross-ventilation for a generic isolated building: impact of computational parameters. Building and Environment , v. 53, p. 34-48, 2012., Tominaga and Blocken (2015)TOMINAGA, Y.; BLOCKEN, B. Wind tunnel experiments on cross-ventilation flow of a generic building with contaminant dispersion in unsheltered and sheltered conditions. Building and Environment , v. 92, p. 452-461, 2015., Hooff, Blocken and Tominaga (2017)HOOFF, T. V.; BLOCKEN, B.; TOMINAGA, Y. On the accuracy of CFD simulations of cross-ventilation flows for a generic isolated building: Comparison of RANS, LES and experiments. Building and Environment , v. 114, p. 148-165, 2017., among others.
A 3D case was adopted to validate the problem due to the limited availability of two-dimensional studies of cross ventilation flow. The study focused on an isolated building model of cross ventilation that contained two openings on the windward and leeward wall (HOOFF; BLOCKEN; TOMINAGA, 2017HOOFF, T. V.; BLOCKEN, B.; TOMINAGA, Y. On the accuracy of CFD simulations of cross-ventilation flows for a generic isolated building: Comparison of RANS, LES and experiments. Building and Environment , v. 114, p. 148-165, 2017.).
After choosing the mesh, a qualitative analysis of the dimensionless time-averaged streamwise velocity and turbulent kinetic energy profiles was carried out inside the building. A total of seven profiles were analyzed and the results were compared to the numerical and experimental results from the literature.
Then the same problem was analyzed, however, this time considering it a two-dimensional case. In the study of the 2D cases, arrangements of three buildings were tested, varying the distance between the buildings and terrain slopes. First, a grid refinement study was carried out for an isolated building. Four levels of grid refinement (coarse, basic, fine and extra fine) were considered. The vertical profiles of dimensionless mean u-velocity (u/u 0 ) were compared and the dimensionless volume flow rate were used to calculate the grid convergence index (GCI) (ROACHE, 1994ROACHE, P. J. Perspective: a method for uniform reporting of grid refinement studies. Journal of Fluids Engineering , v. 116, p. 405-413, 1994.). This method is based on Richardson extrapolation and can be applied for the extra fine grid solution. The GCI is a general parameter that can be applied to any solution variable. The volume flow rate was adopted for the CGI as it is one of the main parameters in the analyses of the present study. After determining the mesh that guarantees the independence of results, the problem of the arrangements of the three buildings was analyzed. The velocity profiles along five vertical lines were studied, located in the middle of each building and separation between them. Subsequently, the dimensionless volume flow rate value was calculated for each building considering four horizontal distances between the buildings and the three terrain slopes. Finally, comparisons of the potential for natural ventilation in each configuration are presented.
Model configuration
Validation: 3D case
For the validation of the numerical simulation, the 3D problem simulated by Hooff, Blocken and Tominaga (2017)HOOFF, T. V.; BLOCKEN, B.; TOMINAGA, Y. On the accuracy of CFD simulations of cross-ventilation flows for a generic isolated building: Comparison of RANS, LES and experiments. Building and Environment , v. 114, p. 148-165, 2017. was used, which is based on the experimental study performed in a wind tunnel by Karava, Stathopoulos and Athienitis (2011)KARAVA, P.; STATHOPOULOS, T.; ATHIENITIS, A. K. Airflow assessment in cross-ventilated buildings with operable façade elements. Building and Environment , v. 46, p. 266-279, 2011. and identified as case E1. It simulates the steady state turbulent flow around a generic building with a parallelepiped format and height H, where the walls and ceiling have a thickness of 0.02H. There are two openings of the same size, one on the windward face and the other on the leeward, as shown in Figure 1.
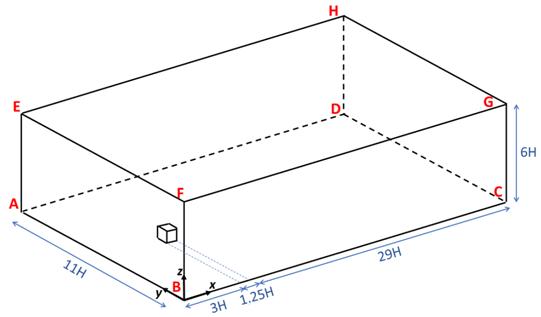
Figure 2 shows the computational domain used, and the dimensions were the same as used by Hooff, Blocken and Tominaga (2017)HOOFF, T. V.; BLOCKEN, B.; TOMINAGA, Y. On the accuracy of CFD simulations of cross-ventilation flows for a generic isolated building: Comparison of RANS, LES and experiments. Building and Environment , v. 114, p. 148-165, 2017., which were based on the recommendations of the guides by Franke et al. (2007)FRANKE, J. et al. Best practice guideline for the CFD simulation of flows in the urban environment. United Kingdom: COST Office, 2007., Tominaga et al. (2008)TOMINAGA, Y. et al. AIJ guidelines for practical applications of CFD to pedestrian wind environment around buildings. Journal of Wind Engineering and Industrial Aerodynamics , v. 96, p. 1749-1761, 2008. and Blocken (2015)BLOCKEN, B. Computational Fluid Dynamics for urban physics: importance, scales, possibilities, limitations and ten tips and tricks towards accurate and reliable simulations. Building and Environment , v. 91, p. 219-245, 2015.. According to Ramponi and Blocken (2012)RAMPONI, R.; BLOCKEN, B. CFD simulation of cross-ventilation for a generic isolated building: impact of computational parameters. Building and Environment , v. 53, p. 34-48, 2012. and Hooff, Blocken and Tominaga (2017)HOOFF, T. V.; BLOCKEN, B.; TOMINAGA, Y. On the accuracy of CFD simulations of cross-ventilation flows for a generic isolated building: Comparison of RANS, LES and experiments. Building and Environment , v. 114, p. 148-165, 2017., the distance of 3H at the beginning of the domain was used to minimize the growth of the boundary layer on the building model.
Main study: 2D cases
In order to analyze how geometric parameters influence the ventilation promoted by the action of wind in arrangements of three buildings, the same building model adopted in the validation was used, however, boundary conditions were applied in order to transform the flow to a two-dimensional problem. The 2D treatment is due to the complexity of creating domains and meshes and the high computational cost. Initially, the flow around a single building was analyzed, and later the study of three buildings arranged in series was carried out, where the separation (L) between them and the terrain slope (α) was varied.
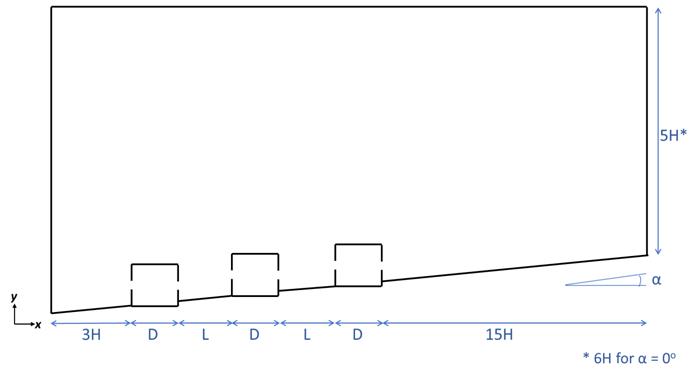
Figure 3 shows the computational domain adopted for the parametric study. The dimensions of the domain (height and length) were based on Hooff, Blocken and Tominaga (2017)HOOFF, T. V.; BLOCKEN, B.; TOMINAGA, Y. On the accuracy of CFD simulations of cross-ventilation flows for a generic isolated building: Comparison of RANS, LES and experiments. Building and Environment , v. 114, p. 148-165, 2017. as well as the recommendations of Franke et al. (2007)FRANKE, J. et al. Best practice guideline for the CFD simulation of flows in the urban environment. United Kingdom: COST Office, 2007. and AIJ guideline (TOMINAGA et al., 2008TOMINAGA, Y. et al. AIJ guidelines for practical applications of CFD to pedestrian wind environment around buildings. Journal of Wind Engineering and Industrial Aerodynamics , v. 96, p. 1749-1761, 2008.). As shown in Figure 3, the distance between the front wall of the upstream building and the domain inlet was reduced to 3H (H =height of the building) to avoid unintended streamwise gradients in the approach flow profiles. The distance from the back wall of the last building to the domain outlet is 15H while the distance from the ground to the top of the domain is 6H for cases with zero terrain slope (α = 0°). For cases with an increase in terrain slope, a height of 5H was adopted at the end of the domain, this height ensures that in the building positions, there will be a total height greater than 6H.
The horizontal distance between buildings (L) was defined according to length of building D. For the distances between buildings, their lengths were taken as the basis, thus, four distances (1D, 2D, 3D and 4D) between buildings and three terrain slopes (0°, 5° and 10°) were adopted. Table 1 details the twelve simulated configurations and their identifications. In the nomenclature of the cases, the letter indicates the terrain slope (A for α = 0°, B for α = 5° and C for α = 10°) and the associated number indicates the distance between the buildings, in terms of length of building.


CFD simulations and computational grids
In the present work, all simulation steps (pre-processing, processing and post-processing) were performed using free software. For the pre-processing stage (computational domain creation and spatial discretization) software Salomé 8.3.0 was used. Processing was performed in open source software OpenFOAM 5.0 and for the post-processing step Paraview 5.4.1 open source software was used. For all the simulated cases, the computational grid consists of hexahedral cells, with a high spatial resolution near the buildings.
Meshes in 3D case
For the 3D model, four levels of spatial discretization were used, the edges of the building were discretized using 30, 40, 50 and 60 control volumes, respectively. Figure 4 shows the computational meshes and close-ups in the vicinity of the buildings with the four grids identified as M1, M2, M3 and M4. The coarse, basic, fine and extra fine grid contain 7.4×10⁵, 1.8×10⁶, 3.4×10⁶ and 5.9×10⁶ control volumes, respectively. The meshes were adopted based on the computational resources available to the authors.

Meshes in 2D cases
For the 2D case, the grid-sensitivity analysis considers four levels of discretization in the case of the isolated building model. The number of cells along the edges of the building are 10, 20, 30 and 40 for the coarse, basic, fine and extra fine grid, respectively. The four grids shown in Figure 5 totalled 3.0×10³, 6.1×10³, 1.4×10⁴ and 2.54×10⁴ control volumes, respectively.
Boundary conditions and solver settings
For the simulations, an inlet velocity profile u(z) of Atmospheric Boundary Layer (ABL) was adopted based on the logarithmic law, Equation 1:
Where, z is the height, the friction velocity u ABL was 0.348 m/s, the Von Karman constant κ was 0.42 and the surface roughness length z 0 was equal to 0.0009 m (HOOFF; BLOCKEN; TOMINAGA, 2017HOOFF, T. V.; BLOCKEN, B.; TOMINAGA, Y. On the accuracy of CFD simulations of cross-ventilation flows for a generic isolated building: Comparison of RANS, LES and experiments. Building and Environment , v. 114, p. 148-165, 2017.). The inflow Reynolds number based on the building roof height (H) and inlet velocity at the height of the building is 4.5×10⁴.
Steady state flow simulations were capable of predicting the global performance of wind-driven ventilation, therefore the Reynolds-averaged Navier-Stokes (RANS) equations were solved and considered an isothermal, turbulent and steady state flow.
For turbulence modeling, the RANS standard k - ε model (LAUNDER; SPALDING, 1974LAUNDER, B. E.; SPALDING, D. B. The numerical computation of turbulent flows. Computer Methods in Applied Mechanics and Engineering, v. 3, n. 2, p. 269-289, 1974.) was used due to the computational cost and the good results presented in several studies (HOOFF; BLOCKEN; TOMINAGA, 2017HOOFF, T. V.; BLOCKEN, B.; TOMINAGA, Y. On the accuracy of CFD simulations of cross-ventilation flows for a generic isolated building: Comparison of RANS, LES and experiments. Building and Environment , v. 114, p. 148-165, 2017.; TORK; TIBIRIÇÁ; TIBIRIÇÁ, 2017TORK, L. D. A.; TIBIRIÇÁ, A. C. G.; TIBIRIÇÁ, A. M. B. Análise da ventilação natural conforme planos diretores: resultados de pesquisa em Belém, PA. Ambiente Construído , Porto Alegre, v. 17, n. 1, p. 339-351, jan./mar. 2017.; LUKIANTCHUKI et al., 2018LUKIANTCHUKI, M. A. et al. Influência do número de sheds e da distância horizontal entre eles no desempenho da ventilação natural. Ambiente Construído , Porto Alegre, v. 18, n. 2, p. 161-176, abr./jun. 2018.). The semi-implicit pressure linked equations (SIMPLE) algorithm was employed to couple the pressure and velocity fields (PATANKAR, 1980PATANKAR, S. V. Numerical heat transfer and fluid flow. London: Hemisphere Publishing, 1980.). For all simulations, a tolerance of 10-4 for each flow variable was defined as a stop condition, as recommended by Franke et al. (2007)FRANKE, J. et al. Best practice guideline for the CFD simulation of flows in the urban environment. United Kingdom: COST Office, 2007.. A maximum of 10,000 time steps were performed.
Second-order upwind flux difference splitting schemes were applied to convective terms and a central differencing scheme for diffusion terms. Moreover, to solve the linear systems of the coupled equations, the GAMG (Generalized Geometric-Algebraic Multi-grid) was adopted for the pressure equations and the smooth solver with Gauss-Seidel scheme for the velocity equations and turbulence variables was used (OPENFOAM…, 2020OPENFOAM FOUNDATION, OpenFOAM User Guide. Available: https://cfd.direct/openfoam/user-guide/. Access: 10 Dec. 2020.
https://cfd.direct/openfoam/user-guide/...
). The relaxation factors were adopted, 0.3 for pressure and 0.7 for the other variables, for more details see Nascimento (2019)NASCIMENTO, A. V. Estudo da ventilação em edifícios através da engenharia do vento computacional com uso do software OpenFOAM. Caruaru, 2019. 130 p. Master Thesis (Master in Civil and Environmental Engineering) - Campus Acadêmico do Agreste, Universidade Federal de Pernambuco, Caruaru, 2019. and OpenFOAM Foundation (2020)OPENFOAM FOUNDATION, OpenFOAM User Guide. Available: https://cfd.direct/openfoam/user-guide/. Access: 10 Dec. 2020.
https://cfd.direct/openfoam/user-guide/...
.

The inflow stream-wise wind velocity profile u(z) was applied to the inlet plane of the domain using Equation 1. The profiles of turbulent kinetic energy (k) and turbulence dissipation rate (ε) are defined by Equations 2 and 3.
Therefore, the inlet turbulent boundary condition k(z) and ε(z) for the standard k - ε model can be determined by Equation 2 and Equation 3. The pressure outlet boundary condition was assigned to the outlet plane with zero static pressure and the velocity was calculated with a zero gradient condition. The other contour conditions in the outlet plane were applied with zero gradient condition. The lateral and top planes are modeled with the symmetry boundary condition. The boundary conditions are summarized in Table 2, see Figure 2 for reference.
For the ground and walls the boundary conditions of non-slip were adopted. Then, zero velocity conditions were used in these contours. In addition, wall functions were also applied to turbulence variables (HONG et al., 2017HONG, S. W. et al. Validation of an open source CFD code to simulate natural ventilation for agricultural buildings. Computers and Electronics in Agriculture, v. 138, p. 80-91, 2017.; TAKANO; MOONEN, 2013TAKANO, Y.; MOONEN, P. On the influence of roof shape on flow and dispersion in an urban street canyon. Journal of Wind Engineering and Industrial Aerodynamics , v. 123, p. 107-120, 2013.), called kqRWallFunction and epsilonWallFunction in OpenFOAM (OPENFOAM…, 2020OPENFOAM FOUNDATION, OpenFOAM User Guide. Available: https://cfd.direct/openfoam/user-guide/. Access: 10 Dec. 2020.
https://cfd.direct/openfoam/user-guide/...
). The boundary condition for eddy viscosity (μ t ) was applied to the ground and walls through OpenFOAM's nutkRoughWallFunction (OPENFOAM…, 2020OPENFOAM FOUNDATION, OpenFOAM User Guide. Available: https://cfd.direct/openfoam/user-guide/. Access: 10 Dec. 2020.
https://cfd.direct/openfoam/user-guide/...
).
Results and analyses
The analyses presented in the following sections demonstrate the natural ventilation in models of buildings with two openings. Section “Validation test: 3D model” presents the study of the three-dimensional and isolated building model, “Grid-sensitivity analysis” and “Comparison of profiles” show the study of grid refinement and the comparison of the results obtained with those of other authors, respectively. In section “Two-dimensional simulations”, the buildings are modeled as two-dimensional and are demonstrated in section “Grid-sensitivity analysis” while the grid refinement study for the isolated model is presented later in section “Velocity profiles: arrangements of buildings”, and the velocity profiles are presented in arrangements containing three models of buildings in which the spacing between them and the slope of the terrain was varied. Finally, section “Flow rate: arrangements of buildings” shows the volumetric flow rates in the three buildings and in the different configurations analyzed.
Validation test: 3D model
Grid-sensitivity analysis
For the validation of the 3D model with two openings, the grids M1, M2, M3 and M4 were used. Figure 6 shows the profiles of the velocity component u, that became dimensionless by using the reference velocity u 0 , for the four grids in three constant values of x/D located inside the building and in the plane of symmetry xz.
Boundary conditions, using Figure 2 for reference - SymCond is Symmetry Condition and WF is Wall Function

The velocity profiles are influenced by the vortices in the building. There are two counter-rotating vortices, one at the top, which rotates counter clockwise, and another at the bottom, more noticeable in the cut "d", which rotates clockwise. The M3 and M4 grids provide almost the same results (mean absolute percentage error of 7.1%), while the results obtained with the coarse (M1) and basic (M2) grids were 24.6% and 11.9%, respectively.
Table 3 shows the volume flow rate, in addition to the values obtained by Hooff, Blocken and Tominaga (2017)HOOFF, T. V.; BLOCKEN, B.; TOMINAGA, Y. On the accuracy of CFD simulations of cross-ventilation flows for a generic isolated building: Comparison of RANS, LES and experiments. Building and Environment , v. 114, p. 148-165, 2017. with six turbulence models, and the experimental result obtained by Tominaga and Blocken (2015)CÓSTOLA, D.; ALUCCI, M. P. Aplicação de CFD para o cálculo de coeficientes de pressão externos nas aberturas de um edifício. Ambiente Construído, Porto Alegre, v. 11, n. 1, p. 145-158, jan./mar. 2011.. All the grids predict a volume flow rate within 11% of the experimental value, with the M4 grid showing the lowest deviation value (3%). It should be noted that the volumetric flow rate found in Hooff, Blocken, and Tominaga (2017)HOOFF, T. V.; BLOCKEN, B.; TOMINAGA, Y. On the accuracy of CFD simulations of cross-ventilation flows for a generic isolated building: Comparison of RANS, LES and experiments. Building and Environment , v. 114, p. 148-165, 2017. with the k - ε turbulence model is similar to that obtained in the M4 grid.
Comparison of profiles
Figure 7 shows dimensionless mean x-velocity (u/u 0 ) obtained in the M4 grid for seven constant x/D values located inside the building model as well as its comparison with numerical (HOOFF; BLOCKEN; TOMINAGA, 2017HOOFF, T. V.; BLOCKEN, B.; TOMINAGA, Y. On the accuracy of CFD simulations of cross-ventilation flows for a generic isolated building: Comparison of RANS, LES and experiments. Building and Environment , v. 114, p. 148-165, 2017.) and experimental (TOMINAGA; BLOCKEN, 2015CÓSTOLA, D.; ALUCCI, M. P. Aplicação de CFD para o cálculo de coeficientes de pressão externos nas aberturas de um edifício. Ambiente Construído, Porto Alegre, v. 11, n. 1, p. 145-158, jan./mar. 2011.) results.
The velocity component profiles were very similar to the numerical results, and were very close to the experimental results. These visual similarities are in accordance with other studies of the same nature (RAMPONI; BLOCKEN, 2012RAMPONI, R.; BLOCKEN, B. CFD simulation of cross-ventilation for a generic isolated building: impact of computational parameters. Building and Environment , v. 53, p. 34-48, 2012.; HOOFF; BLOCKEN; TOMINAGA, 2017HOOFF, T. V.; BLOCKEN, B.; TOMINAGA, Y. On the accuracy of CFD simulations of cross-ventilation flows for a generic isolated building: Comparison of RANS, LES and experiments. Building and Environment , v. 114, p. 148-165, 2017.; ZHANG; WEERASURIYA; TSE, 2020ZHANG, X.; WEERASURIYA, A. U.; TSE, K. T. CFD simulation of natural ventilation of a generic building in various incident wind directions: comparison of turbulence modelling, evaluation methods, and ventilation mechanisms. Energy and Buildings , v. 229, p. 1-57, 2020.). It can be seen that the openings had a strong influence on the topology of the flow, for the three vertical lines located at x/D = 0.125, 0.5 and 0.875, RANS results over-predict the maximum u-velocity by approximately 30.9%, 40.6% and 10.2%, respectively.

Figure 8 shows the dimensionless turbulent kinetic energy profiles and their comparison with numerical and experimental results obtained by Hooff, Blocken and Tominaga (2017)HOOFF, T. V.; BLOCKEN, B.; TOMINAGA, Y. On the accuracy of CFD simulations of cross-ventilation flows for a generic isolated building: Comparison of RANS, LES and experiments. Building and Environment , v. 114, p. 148-165, 2017. and Tominaga and Blocken (2015)CÓSTOLA, D.; ALUCCI, M. P. Aplicação de CFD para o cálculo de coeficientes de pressão externos nas aberturas de um edifício. Ambiente Construído, Porto Alegre, v. 11, n. 1, p. 145-158, jan./mar. 2011., respectively.
When analyzing the results shown in Figure 8, discrepancies were noticed in the values of turbulent kinetic energy in relation to the experimental and numerical results in the RANS turbulence model. Turbulent kinetic energy in the incoming jet central region was overestimated and under predicted in large areas above and below the incoming jet by standard k - ε turbulence model. The higher values obtained along the first two vertical lines (x/D = 0.125 and 0.25) were due to the excessive production of turbulent kinetic energy in a stagnation region which was transported to the interior building and which led to higher indoor values of k/u o 2 . This is a deficiency already known from the k - ε model in flows with separation regions or under the action of adverse pressure gradients, Mohamed and Wood (2015)MOHAMED, M. A.; WOOD, D. H. Modifications to Reynolds-averaged Navier-Stokes turbulence models for the wind flow over buildings. International Journal of Sustainable Energy, v. 36, n. 3, p. 1-17, 2015. and Neto (2020)NETO, A. S. Escoamentos turbulentos: análise física e modelagem teórica. Uberlândia: Composer, 2020..
Two-dimensional simulations
Grid-sensitivity analysis
Initially, a single building model was considered for the grid-sensitivity analysis. Figure 9 shows the vertical profiles of the dimensionless mean u-velocity (u/u 0 ) at the three locations, x/D = 0.125, 0.500 and 0.875, for the four grids considered.


Grid-sensitivity analysis - comparison of dimensionless mean u-velocity (u/u0) obtained with four grids (M1, M2, M3 and M4) in the 2D case
By analyzing Figure 9, one can observe that the M3 and M4 grids provide almost the same dimensionless mean streamwise velocity, however, the results obtained with the M1 grid show deviations from the M2, M3 and M4 grids in all three lines. The mean absolute percentage error in the mean u-velocity (u/u 0 ) between the M3 and M4 grids was less than 13.3% while among M1 and M4 grids it was 68.0%.
Table 4 shows the dimensionless volume flow rate in the building for the four levels of grid refinement. It should be noted that the Q/u 0 Aopen found with the M4 grid was similar to that obtained in the M3 grid. The dimensionless volume flow rate with the M4 grid was 3.2% higher than with the M3 grid.
In order to evaluate the quality of the grid, the GCI (Grid Convergence Index) (CELIK et al., 2008CELIK, I. B. et al. Procedure for estimation and reporting of uncertainty due to discretization in CFD applications. Journal of Fluids Engineering, v. 130, n. 7, 2008.) grid convergence index was used, adopting the volume flow rate as a variable of interest. A GCI was conducted using the latter three grids, M2, M3 and M4. The estimator shows that for the extra fine grid (M4), there was a numerical uncertainty of approximately 3.6% (GCI21 M4 = 0.0364), a value that is within the limits used in the specialized literature (ROJANO, et al., 2019ROJANO, F. et al. Modelling the impact of air discharges caused by natural ventilation in a poultry house. Biosystems Engineering, v. 180, p. 168-181, 2019.; ZHANG; WEERASURIYA; TSE, 2020ZHANG, X.; WEERASURIYA, A. U.; TSE, K. T. CFD simulation of natural ventilation of a generic building in various incident wind directions: comparison of turbulence modelling, evaluation methods, and ventilation mechanisms. Energy and Buildings , v. 229, p. 1-57, 2020.; WANG et al., 2021WANG, Y. et al. The influence of indoor thermal conditions on ventilation flow and pollutant dispersion in downstream industrial workshop. Building and Environment , v. 187, p. 1-55, 2021.). The ratio of [GCI32 M2/(r p GCI21 M4)] results in 1.03, very close to 1.00, which shows that the results are within the asymptotic convergence range, see Roache (1994)ROACHE, P. J. Perspective: a method for uniform reporting of grid refinement studies. Journal of Fluids Engineering , v. 116, p. 405-413, 1994. and Roy (2010)ROY, C. J. Review of discretization error estimators in scientific computing. In: AIAA AEROSPACE SCIENCES MEETING INCLUDING THE NEW HORIZONS FORUM AND AEROSPACE EXPOSITION, 48., Orlando, 2010. Proceedings […]Orlando: American Institute of Aeronautics and Astronautics, 2010.. The grid refinement factor (r) was greater than 1.3 and the observed (apparent) order of accuracy (p) was used as suggested by CELIK et al. (2008)CELIK, I. B. et al. Procedure for estimation and reporting of uncertainty due to discretization in CFD applications. Journal of Fluids Engineering, v. 130, n. 7, 2008.. Therefore, for two-dimensional cases, the M4 grid was adopted, which considers a discretization of 40 volumes in each dimension of the building model.
Velocity profiles: arrangements of buildings
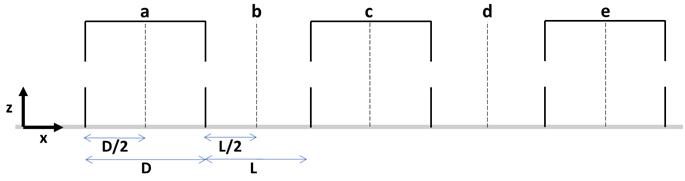
As shown in Table 1, for the analysis of the set of three buildings, four separations between the buildings and three terrain slopes were considered. Figures 10, 11 and 12 show for L = 1D, 2D, 3D and 4D and α = 0°, 5° and 10° the dimensionless mean u-velocity (u/u 0 ) along five vertical lines, see Figure 13 below.
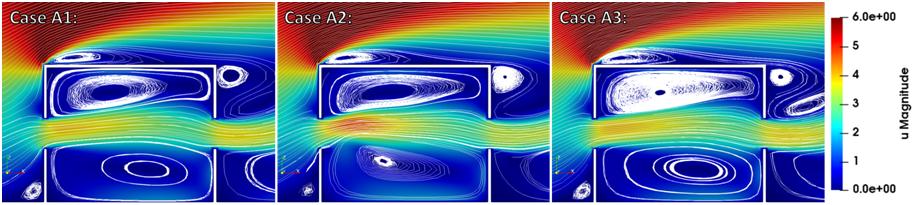
Analyzing Figure 10, it can be observed that inside the buildings (Figures 10a, 10c and 10e) there were no large variations for most velocity profiles in the case of no terrain slope (cases A), similar results were observed in other studies (HOOFF; BLOCKEN; TOMINAGA, 2017HOOFF, T. V.; BLOCKEN, B.; TOMINAGA, Y. On the accuracy of CFD simulations of cross-ventilation flows for a generic isolated building: Comparison of RANS, LES and experiments. Building and Environment , v. 114, p. 148-165, 2017.; ZHANG; WEERASURIYA; TSE, 2020ZHANG, X.; WEERASURIYA, A. U.; TSE, K. T. CFD simulation of natural ventilation of a generic building in various incident wind directions: comparison of turbulence modelling, evaluation methods, and ventilation mechanisms. Energy and Buildings , v. 229, p. 1-57, 2020.). However, the increase in the separation between the first and second buildings leads to significant changes in the velocity profiles in Figure 10b, for example, the maximum speed in case A4 decreases 30.9% in relation to the A1 case and moves from z/H = 0.55 to z/H = 1.0. In general, changes in velocity profiles lead to changes in flow topology. In addition, it was observed that the increase in the separation between the buildings induces a slight displacement of the maximum dimensionless mean u-velocity peak inside the third building, see Figure 10e. For example, in the cases A1 and A2, the maximum velocity point (component u) was close to 0.05H, while for the case A4, the peak velocity was 0.35H. The topology of the flow inside the buildings does not change with the increase in the separation between them. In the first building a pair of counter-rotating vortices can be seen, however, in the second and third building there were large clockwise vortices.
In cases B (terrain slope angle equal to 5o), Figure 11, it was verified that the increase in the separation between buildings leads to significant changes in the mean velocity profiles and therefore in the topology of the flow. For example in Figure 11b, the maximum velocity point for the case B1 is at z/H = 0.30H, while for the case B4, this same point is at 1.0H. Thus, this leads to changes in the topology of the flow, for example, inside the second (Figure 11c) and third (Figure 11e) buildings the increase in the separation between the buildings produces the transition from a large clockwise vortex (case "B1") to a pair of counter-rotating vortices (case "B4").
One can observe in Figure 12 that the dimensionless mean u-velocity (u/u 0 ) profiles in the case with a terrain slope equal to 10° were similar to those obtained in cases B, however, it can be seen that the increase in the separation between buildings leads to an increase in the velocity values. For example, the value of the maximum speed between cases B4 and C4 increases 31.2% in the second building and 29.7% in the third building, respectively.


Flow rate:arrangements of buildings
Table 5 shows the values of the dimensionless volume flow rate in the three buildings for the twelve cases analyzed (four separates between the buildings and three terrain slopes). For comparative purposes, the volume flow rate value was also shown in the case of an isolated building (Qisolated).
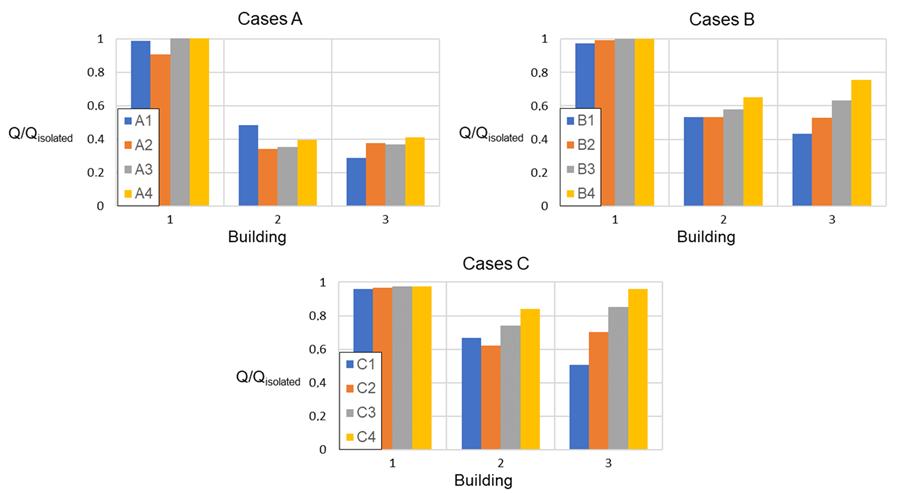
In general, it can be observed that the increase in the separation between the buildings and the increase in the terrain slope improves the efficiency of the ventilation promoted by the action of the wind, especially in the second and third buildings. For example, when comparing cases A1 and A4, in the second and third buildings, there was a variation of approximately 18% and 42% in the volume flow rate, respectively, and, from case A1 to case C1 (increase in slope of the terrain from 0° to 10°), for the same buildings, there was an increase of 27% and 74% in the volume flow rate, respectively. In order to facilitate the interpretation of the results, Figure 14 shows the value of the volume flow rate in relation to the case of an isolated building.
It can be seen that for the first building the value of the dimensionless flow rate remains practically independent of the separation between the buildings and the terrain slope and is close to 1 (compared to the isolated building, the maximum deviation was 9%). However, it was observed that case A2 has a value lower than 1. Thus, to analyze what happens in this case, Figure 15 shows the mean streamlines within the first building in cases A1, A2 and A3. Analyzing the mean streamlines, two vortices in the building can be seen, an anti-clockwise vortex (top region) and a clockwise vortex (bottom region). As shown in the streamlines from Figure 15 (Case A2), the recirculation flow region occupies a larger area near the bottom and in the incoming jet region when compared to cases A1 and A3, reducing the value of the effective area at the entrance as well as the flow in the first building.


The values of the dimensionless flow rate for the second and third buildings are always less than 1, regardless of the separation between the buildings and the slope of the terrain. This demonstrates that the ventilation promoted by the action of the wind was lower than the value obtained for the case of the isolated building. It was observed that the increase in the value of the dimensionless volume flow rate due to the increase in the separation between the buildings was smaller when compared to the increment originated by the increase in the slope of the terrain.
In the second building, the volumetric flow increased 4% with the increase in distance and 36% when the terrain slope increases. For the third building, the volumetric flow value increases approximately 19% and 45% with the increase in the distance and slope of the terrain, respectively.
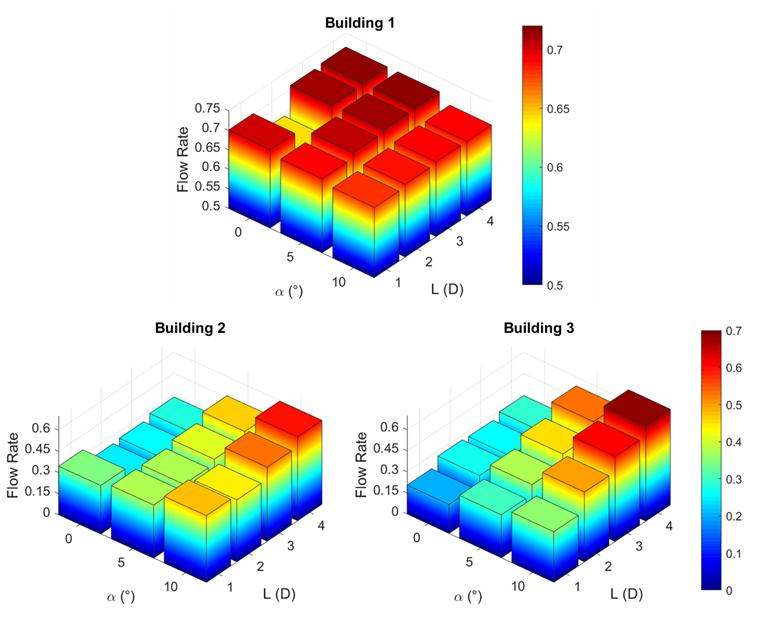
Figure 16 shows the variation in the volume flow rate in each of the three buildings as a function of the separation between the buildings (L) and the slope of the terrain (α).
It can be seen that the increase in the terrain slope caused an increase in the volume flow rates for the second and third buildings. Furthermore, this behavior was also observed when increasing the separation between buildings, although it was proportionally lower than the effect of the terrain slope, as previously verified. It should be emphasized that, as previously observed, the variations in the first building were much lower than those obtained in the second and third buildings, so the first building in Figure 16 has its own scale. Moreover, it was observed that the variation in this case does not present a defined behavior with respect to L and α.
When analyzing the C4 case (greater separation and slope), it was observed that the volume flow rate in the last building had practically the same order of magnitude as in the first building (a difference of 1.6%). In turn, the second building had the best volume flow rate when compared to all the cases studied, for example, when comparing it with the second best case (C3) there was a 13% increase, representing a significant gain within the values obtained in the present work.

Variation in volume flow rate as a function of separation (L) and terrain slope (a) for the case with three buildings
Conclusion
In the present work, the ventilation promoted by the action of wind in a set of three simple models of low-rise buildings was studied through numerical simulation in order to analyze the influence that the separation between the buildings and terrain slope have on the ventilation inside the buildings.
Initially, a three-dimensional model of low-rise building with openings in opposite faces was considered for the validation of the algorithms and basic solvers used in OpenFOAM. The results obtained showed good agreement when compared with the experimental and numerical references available in the literature. Subsequently, the flow around an arrangement of three models of low-rise buildings was analyzed, where four values of separation between the buildings (L = 1D, 2D, 3D and 4D) and three terrain slopes (0°, 5° and 10°) were investigated.
The following conclusions can be drawn from the present study:
-
for the tested cases, the simulations using the OpenFOAM software and the RANS standard k - ε model showed good results. For the validation case, the deviation was only 3.0%.
-
the natural ventilation promoted by the action of the wind in the set of buildings was strongly influenced by the separation between the buildings (L) and terrain α slope (). When comparing cases A1 and A4 (increase of four times the separation), in the second and third buildings, there was a variation of approximately 18% and 42% in the volume flow rate, respectively, and, from case A1 to case C1 (increase in terrain slopefrom 0° to 10°), for the same buildings, there was a 27% and 74 % increase in the volume flow rate, respectively;
-
the volume flow rate value in the first building can be considered independent of the L and α, because when comparing the volume flow rate the isolated building showed a maximum deviation of 9%;
-
as seen in Figure 14, the volume flow rates for the second and third buildings were always lower than those presented for the first building due to a recirculation flow region;
-
as seen in Figure 16, the increase in the terrain slopewas more efficient at increasing the value of the volume flow rate when compared to the increase in the separation between the buildings studied; and
-
the use of free software such as OpenFOAM, Salome and Paraview proved to be very satisfactory and efficient for the tested cases. OpenFOAM is an excellent tool for CFD applications showing accuracy, speed and robustness, however, it has a steep learning curve when compared with commercial software.
Acknowledgements
This study was financed in part by the Fundação de Amparo à Ciência e Tecnologia do Estado de Pernambuco (FACEPE), Proc. APQ-0225-3-05/14, and the Coordenação de Aperfeiçoamento de Pessoal de Nível Superior - Brasil (CAPES) - Finance Code 001. This work used resources of the Centro Nacional de Processamento de Alto Desempenho em São Paulo (CENAPAD-SP).
References
- ABOHELA, I.; HAMZA, N.; DUDEK, S. Effect of roof shape, wind direction, building height and urban configuration on the energy yield and positioning of roof mounted wind turbines. Renewable Energy, v. 50, p. 1106-1118, 2013.
- AI, Z. T.; MAK, C. M. Wind-induced single-sided natural ventilation in buildings near a long street canyon: CFD evaluation of street configuration and envelope design. Journal of Wind Engineering & Industrial Aerodynamics, v. 172, p. 96-106, 2018.
- ALLARD, F.; GHIAUS, C. Natural ventilation in the urban environment: assessment and design. London: Routledge, 2005.
- ALMEIDA, M. S.; ARAÚJO, A. D.; ALMEIDA, M. P. Tall building influence on city wind pattern. International Journal of Modern Physics C, v. 29, n. 10, p. 1-20, 2018.
- AMINI, S. et al Numerical simulation of the Mexico wind turbine using the actuator disk model along with the 3D correction of aerodynamic coefficients in OpenFOAM. Renewable Energy , v. 163, p. 2029-2036, 2021.
- AMORES, C. P. et al Natural ventilation analysis in an underground construction: CFD simulation and experimental validation. Tunnelling and Underground Space Technology, v. 90, p. 162-173, 2019.
- ARINAMI, Y. et al Performance evaluation of single-sided natural ventilation for generic building using large-eddy simulations: Effect of guide vanes and adjacent obstacles. Building and Environment, v. 154, p. 68-80, 2019.
- BADAS, M. G. et al On the effect of gable roof on natural ventilation in two-dimensional urban canyons. Journal of Wind Engineering and Industrial Aerodynamics, v. 162, p. 24-34, 2017.
- BLOCKEN, B. Computational Fluid Dynamics for urban physics: importance, scales, possibilities, limitations and ten tips and tricks towards accurate and reliable simulations. Building and Environment , v. 91, p. 219-245, 2015.
- BLOCKEN, B.; STATHOPOULOS, T.; BEECK, J. P. A. J. V. Pedestrian-level wind conditions around buildings: review of wind-tunnel and CFD techniques and their accuracy for wind comfort assessment. Building and Environment , v. 100, p. 50-81, 2016.
- CAO, X.; DAI, X.; LIU, J. Building energy-consumption status worldwide and the state-of-the-art technologies for zero-energy buildings during the past decade. Energy and Buildings, v. 128, p. 198-213, 2016.
- CELIK, I. B. et al Procedure for estimation and reporting of uncertainty due to discretization in CFD applications. Journal of Fluids Engineering, v. 130, n. 7, 2008.
- CHENG, J. et al CFD-PBE simulation of a bubble column in OpenFOAM. Chinese Journal of Chemical Engineering, v. 26, n. 9, p. 1773-1784, 2018.
- CHEUNG, J. O. P.; LIU, C. H. CFD simulations of natural ventilation behaviour in high-rise buildings in regular and staggered arrangements at various spacings. Energy and Buildings , v. 43, p. 1149-1158, 2011.
- CÓSTOLA, D.; ALUCCI, M. P. Aplicação de CFD para o cálculo de coeficientes de pressão externos nas aberturas de um edifício. Ambiente Construído, Porto Alegre, v. 11, n. 1, p. 145-158, jan./mar. 2011.
- EMPRESA DE PESQUISA ENERGÉTICA. Nota Técnica EPE 030/2018: uso de ar condicionado no setor residencial brasileiro. Rio de Janeiro, 2018.
- EUROPEAN CENTRE FOR DISEASE PREVENTION AND CONTROL. Heating, ventilation and air-conditioning systems in the context of COVID-19. European Union, 2020.
- FONTENELLE, M. R.; BASTOS, L. E. G.; LORENTE, S. Natural ventilation for office building retrofit in dense urban context under hot and humid climate. Ambiente Construído, Porto Alegre, v. 21, n. 2, p. 67-87, abr./jun. 2021.
- FRANKE, J. et al Best practice guideline for the CFD simulation of flows in the urban environment. United Kingdom: COST Office, 2007.
- GHADIKOLAEI, F. M.; OSSEN, D. R.; MOHAMED, M. F. Effects of wing wall at the balcony on the natural ventilation performance in medium-rise residential buildings. Journal of Building Engineering, v. 31, p. 1-14, 2020.
- GUPTA, D.; KHARE, V. R. Natural ventilation design: predicted and measured performance of a hostel building in composite climate of India. Energy and Built Environment, v. 2, n. 1, p. 82-93, 2021.
- HE, P. et al An aerodynamic design optimization framework using a discrete adjoint approach with OpenFOAM. Computers & Fluids, v. 168, p. 285-303, 2018.
- HONG, S. W. et al Validation of an open source CFD code to simulate natural ventilation for agricultural buildings. Computers and Electronics in Agriculture, v. 138, p. 80-91, 2017.
- HOOFF, T. V.; BLOCKEN, B.; TOMINAGA, Y. On the accuracy of CFD simulations of cross-ventilation flows for a generic isolated building: Comparison of RANS, LES and experiments. Building and Environment , v. 114, p. 148-165, 2017.
- KARAVA, P.; STATHOPOULOS, T.; ATHIENITIS, A. K. Airflow assessment in cross-ventilated buildings with operable façade elements. Building and Environment , v. 46, p. 266-279, 2011.
- KING, M. F. et al Investigating the influence of neighbouring structures on natural ventilation potential of a full-scale cubical building using time-dependent CFD. Journal of Wind Engineering and Industrial Aerodynamics , v. 169, p. 265-279, 2017.
- KOSUTOVA, K. et al Cross ventilation in a generic isolated building equipped with louvers: Wind-tunnel experiments and CFD simulations. Building and Environment , v. 154, p. 263-280, 2019.
- LARSEN, T. S. et al Characterization and prediction of the volume flow rate aerating a cross ventilated building by means of experimental techniques and numerical approaches. Energy and Buildings , v. 43, n. 6, p. 1371-1381, 2011.
- LAUNDER, B. E.; SPALDING, D. B. The numerical computation of turbulent flows. Computer Methods in Applied Mechanics and Engineering, v. 3, n. 2, p. 269-289, 1974.
- LIU, S. et al CFD simulations of natural cross ventilation through an apartment with modified hourly wind information from a meteorological station. Energy and Buildings , v. 195, p. 16-25, 2019.
- LUKIANTCHUKI, M. A. et al Influência do número de sheds e da distância horizontal entre eles no desempenho da ventilação natural. Ambiente Construído , Porto Alegre, v. 18, n. 2, p. 161-176, abr./jun. 2018.
- MOHAMED, M. A.; WOOD, D. H. Modifications to Reynolds-averaged Navier-Stokes turbulence models for the wind flow over buildings. International Journal of Sustainable Energy, v. 36, n. 3, p. 1-17, 2015.
- MORAIS, J. M. S. C.; LABAKI, L. C. CFD como ferramenta para simular ventilação natural interna por ação dos ventos: estudos de caso em tipologias verticais do “Programa Minha Casa, Minha Vida”. Ambiente Construído , Porto Alegre, v. 17, n. 1, p. 223-244, jan./mar. 2017.
- MORAWSKA, L.; MILTON, D. K. It Is Time to address airborne transmission of coronavirus disease 2019 (COVID-19). Clinical Infectious Diseases, v. 71, n. 9, p. 2311-2313, 2020.
- NABONI, E. et al A digital workflow to quantify regenerative urban design in the context of a changing climate. Renewable and Sustainable Energy Reviews, v. 113, p. 109255, 2019.
- NASCIMENTO, A. V. Estudo da ventilação em edifícios através da engenharia do vento computacional com uso do software OpenFOAM. Caruaru, 2019. 130 p. Master Thesis (Master in Civil and Environmental Engineering) - Campus Acadêmico do Agreste, Universidade Federal de Pernambuco, Caruaru, 2019.
- NETO, A. S. Escoamentos turbulentos: análise física e modelagem teórica. Uberlândia: Composer, 2020.
- NGUYEN, A. T.; REITER, S. The effect of ceiling configurations on indoor air motion and ventilation flow rates. Building and Environment , v. 46, p. 1211-1222, 2011.
- OPENFOAM FOUNDATION, OpenFOAM User Guide. Available: https://cfd.direct/openfoam/user-guide/ Access: 10 Dec. 2020.
» https://cfd.direct/openfoam/user-guide/ - PATANKAR, S. V. Numerical heat transfer and fluid flow. London: Hemisphere Publishing, 1980.
- PERÉN, J. I. et al CFD analysis of cross-ventilation of a generic isolated building with asymmetric opening positions: Impact of roof angle and opening location. Building and Environment , v. 85, p. 263-276, 2015.
- PUGLIESE, V.; ETTEHADTAVAKKOL, A.; PANACHAROENSAWAD, E. Drift flux model parameters estimation based on numerical simulation of slug flow regime with high-viscous liquids in pipelines. International Journal of Multiphase Flow, v. 135, p. 1-55, 2021.
- RAMPONI, R.; BLOCKEN, B. CFD simulation of cross-ventilation for a generic isolated building: impact of computational parameters. Building and Environment , v. 53, p. 34-48, 2012.
- REN, J. et al Numerical study of three ventilation strategies in a prefabricated COVID-19 inpatient ward. Building and Environment , v. 188, n. 4, p. 1-17, 2021.
- ROACHE, P. J. Perspective: a method for uniform reporting of grid refinement studies. Journal of Fluids Engineering , v. 116, p. 405-413, 1994.
- ROJANO, F. et al Modelling the impact of air discharges caused by natural ventilation in a poultry house. Biosystems Engineering, v. 180, p. 168-181, 2019.
- ROY, C. J. Review of discretization error estimators in scientific computing. In: AIAA AEROSPACE SCIENCES MEETING INCLUDING THE NEW HORIZONS FORUM AND AEROSPACE EXPOSITION, 48., Orlando, 2010. Proceedings […]Orlando: American Institute of Aeronautics and Astronautics, 2010.
- SEN, S; ROESLER, J. Wind direction and cool surface strategies on microscale urban heat island. Urban Climate, v. 31, p. 1-15, 2020.
- TAKANO, Y.; MOONEN, P. On the influence of roof shape on flow and dispersion in an urban street canyon. Journal of Wind Engineering and Industrial Aerodynamics , v. 123, p. 107-120, 2013.
- TOMINAGA, Y. et al AIJ guidelines for practical applications of CFD to pedestrian wind environment around buildings. Journal of Wind Engineering and Industrial Aerodynamics , v. 96, p. 1749-1761, 2008.
- TOMINAGA, Y.; BLOCKEN, B. Wind tunnel experiments on cross-ventilation flow of a generic building with contaminant dispersion in unsheltered and sheltered conditions. Building and Environment , v. 92, p. 452-461, 2015.
- TORK, L. D. A.; TIBIRIÇÁ, A. C. G.; TIBIRIÇÁ, A. M. B. Análise da ventilação natural conforme planos diretores: resultados de pesquisa em Belém, PA. Ambiente Construído , Porto Alegre, v. 17, n. 1, p. 339-351, jan./mar. 2017.
- TRINDADE, S. C.; PEDRINI, A.; DUARTE, R. N. C. Métodos de aplicação da simulação computacional em edifícios naturalmente ventilados no clima quente e úmido. Ambiente Construído , Porto Alegre, v. 10, n. 4, p. 37-58, out./dez. 2010.
- UEMATSU, Y.; ISYUMOV, N. Wind pressures acting on low-rise buildings. Journal of Wind Engineering and Industrial Aerodynamics , v. 82, p. 1-25, 1999.
- VARELA-BOYDO, C. A.; MOYA, S. L. Inlet extensions for wind towers to improve natural ventilation in buildings. Sustainable Cities and Society, v. 53, p. 1-11, 2020.
- VERSTEEG, H. K.; MALALASEKERA, W. An introduction to computational fluid dynamics: the finite volume method. Essex: Pearson Prentice Hall, 2007.
- VERVOORT, R.; BLOCKEN, B.; HOOFF, T. V. Reduction of particulate matter concentrations by local removal in a building courtyard: Case study for the Delhi American Embassy School. Science of The Total Environment, v. 686, p. 657-680, 2019.
- WANG, Y. et al The influence of indoor thermal conditions on ventilation flow and pollutant dispersion in downstream industrial workshop. Building and Environment , v. 187, p. 1-55, 2021.
- WU, Z.; DOU, P.; CHEN, L. Comparative and combinative cooling effects of different spatial arrangements of buildings and trees on microclimate. Sustainable Cities and Society , v. 51, p. 1-32, 2019.
- YI, P. et al Experimental and numerical investigation of low sulfur heavy fuel oil spray characteristics under high temperature and pressure conditions. Fuel, v. 286, part 2, p. 1-16, 2021.
- ZHANG, X.; WEERASURIYA, A. U.; TSE, K. T. CFD simulation of natural ventilation of a generic building in various incident wind directions: comparison of turbulence modelling, evaluation methods, and ventilation mechanisms. Energy and Buildings , v. 229, p. 1-57, 2020.
- ZHANG, Y.; DENG, S.; WANG, X. RANS and DDES simulations of a horizontal-axis wind turbine under stalled flow condition using OpenFOAM. Energy, v. 167, p. 1155-1163, 2019.
Publication Dates
-
Publication in this collection
16 Mar 2022 -
Date of issue
Apr-Jun 2022
History
-
Received
04 May 2021 -
Accepted
09 Aug 2021