Abstract
Residential electricity consumption in Brazil has been growing during the last few decades, creating a potential opportunity to expand energy efficiency measures. However, the dimension of the sector and its closed relationship with the economic, cultural, and demographic processes causes a certain complexity in the understanding of patterns of consumption, creating additional challenges to energy policies. This study analyzed and decomposed the Brazilian residential electricity consumption between the years of 2000 and 2018, by driving factors through the LMDI-I method and IDA index, on regional level. All the data were obtained by official sources in the country. The main results obtained were: (i) the increase of household numbers was found to be one of the main drivers of consumption growth; (ii) household income showed no control over consumption in hot climate regions, except in low- income households; (iii) tariff showed to impose restrictions on consumption, also mainly in low-income households. Unprecedentedly, the results showed that the electricity consumption in Brazil varies with population age, with a trend of consumption growth up to the age 59, and a sharp reduction from the age of 60. The study presents opportunities to be contemplated in research and in energy policies.
Keywords:
Electricity consumption; LMDI; Households; Population; Age group
Resumo
O consumo de energia elétrica pelo setor residencial no Brasil tem apresentado crescimento acelerado nas últimas décadas, significando espaço potencial para ampliar as medidas de eficiência energética. No entanto, a dimensão do setor e sua estreita relação com os processos econômicos, culturais e demográficos tornam complexa a compreensão dos padrões do consumo, criando desafios adicionais as políticas energéticas. Esse estudo analisou e decompôs o consumo residencial de energia elétrica do Brasil, entre os anos 2000 e 2018, por fatores direcionadores através do método LMDI e do índice IDA, em nível regional. Todos os dados foram obtidos através de fontes oficiais do país. Os principais resultados obtidos foram: (i) o crescimento do número de domicílios foi reconhecido como um dos maiores impulsionadores do crescimento do consumo; (ii) a renda domiciliar mostrou não possuir controle sobre o consumo nas regiões de clima quente, exceto nos domicílios de baixa renda; (iii) a tarifa mostrou impor restrição no consumo, principalmente nos domicílios de baixa renda. De forma inédita, os resultados mostraram que o consumo residencial de energia elétrica no Brasil varia com a idade da população, havendo tendência de crescimento do consumo até 59 anos de idade, e uma brusca redução a partir de 60 anos de idade. O estudo apresenta oportunidades a serem contempladas em pesquisas, e nas políticas energéticas.
Palavras-chave:
Consumo de energiaelétrica; LMDI; Domicílios; População; Grupoetário
Introduction
Electricity consumption in the world is growing in high rates and the electricity dependence of societies has been gradually increasing. In 2018, total electricity consumption in Brazil was of 535,403 GWh, which corresponds to 40.0% of Latin American consumption, and 2.3% of the world electricity consumption (EMPRESA…, 2019aEMPRESA DE PESQUISA ENERGÉTICA. Balanço Energético Nacional 2019: ano base 2018. Available at: http://www.epe.gov.br/pt/publicacoes-dados-abertos/publicacoes/balanco-energetico-nacional-2019. Access in: 15 dec. 2019a.
http://www.epe.gov.br/pt/publicacoes-dad...
; ENERDATA, 2020ENERDATA. Global Energy Statistical Yearbook 2019 - Electricity. Available at: https://yearbook.enerdata.net/electricity/electricity-domestic-consumption-data.html. Access in: 15 apr. 2020.
https://yearbook.enerdata.net/electricit...
).
The residential sector in Brazil, which comprised households and 85.4% of consumer units in 2018, is the second sector with the highest electricity consumption, behind the industrial sector, and participated with 25.4% of total consumption in 2018. Between the years of 2017 and 2018, residential electricity consumption recorded a growth of 1.3%, more than 2 times higher than the growth in consumption by commercial and industrial sectors, creating a potential opportunity for expansion of the implementation of energy efficiency measures (ABRAHÃO; SOUZA, 2021ABRAHÃO, K. C. F. J.; SOUZA, R. V. G. Estimativa da evolução do uso final de energia elétrica no setor residencial do Brasil por regiões geográficas. Ambiente Construído, Porto Alegre, 2021.; EMPRESA…, 2019aEMPRESA DE PESQUISA ENERGÉTICA. Balanço Energético Nacional 2019: ano base 2018. Available at: http://www.epe.gov.br/pt/publicacoes-dados-abertos/publicacoes/balanco-energetico-nacional-2019. Access in: 15 dec. 2019a.
http://www.epe.gov.br/pt/publicacoes-dad...
; AGÊNCIA…, 2020aAGÊNCIA NACIONAL DE ENERGIA ELÉTRICA. Informações técnicas: consumidores ano 2018. Available at: https://www2.aneel.gov.br/area.cfm?idArea=550. Access in: 15 apr. 2020a.
https://www2.aneel.gov.br/area.cfm?idAre...
; MORISHITA; GHISI, 2010MORISHITA, C.; GHISI, E. Assessment of the impact of energy-efficiency household appliances on the electricity consumption in the residential sector of Brazil. In: WORLD ENERGY COUNCIL CONGRESS, Montreal, 2010. Proceedings … Montreal: World Energy Council Congress, 2010.).
In 2018, the country accounted for 68.9 million households, of which 97.4% were supplied by electricity service, with 85.5% of them located in urban areas and 14.5% in rural areas. These data do not count rural households in the Northern region, area of the Amazon forest (INSTITUTO…, 2020eINSTITUTO BRASILEIRO DE GEOGRAFIA E ESTATÍSTICA. Pesquisa Nacional por Amostra de Domicílios - PNAD: downloads - grandes regiões. Available at: https://www.ibge.gov.br/estatisticas/sociais/trabalho/17270-pnad-continua.html?=&t=downloads. Access in: 15 jan. 2020e.
https://www.ibge.gov.br/estatisticas/soc...
).
The world's population is aging. Technological development, medicine and public hygiene have increased the longevity of people, which added to the natural process of fertility decline, has resulted in a rapid growth of the population of age 60 and above. This phenomenon, identified as the process of demographic transition, is more accelerated in countries and regions with a more developed economy, and presents challenges that intercept social issues and public policies, including energy ones (ZAIDI, 2015ZAIDI, A. Aging and development. Professional development reading pack, N. 25. Applied Knowledge Services - GSDRC. November, 2015. Available at: Available at: http://www.gsdrc.org/wp-content/uploads/2015/11/Aging-and-Development_RP1.pdf . Access in: 15 mar. 2020.
http://www.gsdrc.org/wp-content/uploads/...
). The demographic transition process also occurs in Brazil, with a more advanced stage in the Southeast and South regions. This process is even more intense in the Brazilian rural areas, due to the urbanization phenomenon association. With the interest to refine the understanding of residential electricity consumption growth, in recent years, the literature has been introducing population age and demographic processes in the analyses (BARDAZZI; PAZIENZIA, 2020BARDAZZI, R.; PAZIENZA, M.G. When I was your age: generational effects on long-run residential energy consumption in Italy. Energy Research &Social Science, v. 70, 2020.; ESTIRI; ZAGHENI, 2019ESTIRI, H.; ZAGHENI, E. Age matters: aging and household energy demand in the United States. Energy Research and Social Science, v. 5, p. 62-70, 2019.; LIDDLE, 2013LIDDLE, B. Population, affluence, and environmental impact across development: evidence from panel cointegration modeling. Environmental Modelling & Software, v. 40, p. 255-266, 2013.; DEUTSCH; TIMPE, 2013DEUTSCH, M.; TIMPE, P. The effect of age on residential energy demand. In: EUROPEAN COUNCIL FOR AN ENERGY EFFICIENT ECONOMY SUMMER STUDY, Hyères, 2013. Proceedings … Hyères: ECEEE Summer Study, 2013.; PESSANHA; LEON, 2012PESSANHA, J.F.M.; LEON, N. Long-term forecasting of household and residential electric customers in Brazil. IEEE Latin America Transaction, v.10, n. 2, p.1537-1543, 2012., 2015PESSANHA, J. F. M.; LEON, N. Forecasting long-term electricity demand in the residential sector. Population Environmental , v. 55, p. 529-538, 2015.; BROUNEN; KOK; QUIGLEY, 2012BROUNEN, D.; KOK, N.;QUIGLEY, J. M. Residential energy use and conservation: economics and demographics. European Economic Review, 56, p.931-945, 2012. ; TONN; EISENBERG, 2006TONN, B.; EISENBERG, J. The aging US population and residential energy demand. Energy Policy , v. 35, p. 743-745, 2006.; O’NEIL; CHEN, 2002O’NEIL, B. C.; CHEN, B. S. Demographic determinants of household energy use in the United States. Population and Development Review, v. 28, p. 53-88, 2002.).
The Brazilian population projected in 2018 was of 208.5 million inhabitants, with an increase expectation of 16.4 million by the year 2030 (INSTITUTO…, 2020bINSTITUTO BRASILEIRO DE GEOGRAFIA E ESTATÍSTICA. Projeções da População por sexo e idade - Brasil: 2000-2060 e Unidades da Federação - 2000-2030. Available at: https://www.ibge.gov.br/estatisticas/sociais/populacao/9109-projecao-da-populacao.html?edicao=9116&t=resultados. Access in:15 jan. 2020b.
https://www.ibge.gov.br/estatisticas/soc...
). This growth will require an increase in the number of households, and an expansion in the capacity of electricity generation to meet the energy consumption growth. In addition to the expansion of population and household numbers, other factors such as family income, electricity tariff, economic growth, climate, increase of appliance ownership, penetration of new appliances and technologies that offer personal and home services, use intensity of equipment, connectivity by internet, and a change in consumer preferences may also contribute to the growth of residential electricity consumption (ABRAHÃO; SOUZA, 2021ABRAHÃO, K. C. F. J.; SOUZA, R. V. G. Estimativa da evolução do uso final de energia elétrica no setor residencial do Brasil por regiões geográficas. Ambiente Construído, Porto Alegre, 2021.; VILLAREAL; MOREIRA, 2019VILLAREAL, M. J. C.; MOREIRA, J. M. L. Household consumption of electricity in Brazil between 1985 and 2013. Energy Policy , v. 96, p. 251-259, 2019.; PESSANHA; LEON, 2015PESSANHA, J. F. M.; LEON, N. Forecasting long-term electricity demand in the residential sector. Population Environmental , v. 55, p. 529-538, 2015.; ACHÃO; SCHAEFFER, 2009ACHÃO, C. C. L.; SCHAEFFER, R. Decomposition analysis of the variations in residential electricity consumption in Brazil for the 1980-2007 period: Measuring the activity, intensity and structure effects. Energy Policy, v. 37, p. 5208-5220, 2009.; GHISI; GOSCH; LAMBERTS, 2007GHISI, E.; GOSCH, S.; LAMBERTS, R. Electricity end-uses in the residential sector of Brazil. Energy Policy , v. 35, n. 8, p. 789-202, 2007.; ALMEIDA; SCHAEFFER; LA ROVERE, 2001ALMEIDA, M. A.; SCHAEFFER, R.; LA ROVERE, E. L. The potential for electricity conservation and peak load reduction in the residential sector of Brazil. Energy, v. 26, n. 4, p. 413-429, 2001. ). On the other hand, energy efficiency policies help to slow electricity consumption growth (MORISHITA; GHISI, 2010MORISHITA, C.; GHISI, E. Assessment of the impact of energy-efficiency household appliances on the electricity consumption in the residential sector of Brazil. In: WORLD ENERGY COUNCIL CONGRESS, Montreal, 2010. Proceedings … Montreal: World Energy Council Congress, 2010.). However, opportunities for detailing energy policies could come from understanding how much some factors boost the growth of electricity consumption. Within this context, an increasing application of the Index Decomposition Analysis method - IDA is observed in the literature, in order to investigate the effects and contributions of variables and indicators in the variation of consumption by residential sector, for a determined period. Most studies use the Logarithmic Mean Divisia Index method I (LMDI-I) as a decomposition technique to support the IDA method, given its characteristics of easy application and perfect decomposition (ANG, 2015ANG, B.W. LMDI decomposition approach: a guide for implementation. Energy Policy , v. 86, p. 233-238, 2015., 2004ANG, B. W. Decomposition analysis for policymaking in energy: which is the preferred method? Energy Policy , v. 32, p.1131-1139, 2004.; XU; ANG, 2014XU, X.Y.; ANG, B.W. Analyzing residential energy consumption using index decomposition analysis. Applied Energy , v. 113, p. 342-351, 2014.; ANDRADE; PINHEIRO, 2014ANDRADE, F. V.; PINHEIRO, R. B. Análise de decomposição da projeção de consumo residencial de energia elétrica no Brasil para o setor residencial. Engevista, v. 16, n. 4, p. 340-355, 2014.; ACHÃO; SCHAEFFER, 2009ACHÃO, C. C. L.; SCHAEFFER, R. Decomposition analysis of the variations in residential electricity consumption in Brazil for the 1980-2007 period: Measuring the activity, intensity and structure effects. Energy Policy, v. 37, p. 5208-5220, 2009.). Another advantage of the LMDI-I is the application of IDA at levels or sectors, providing refinement in the analysis.
The literature has a wide investigation within the context of Brazilian residential electricity consumption, although few of these studies considered demographic aspects and processes, such as the studies of Leon and Pessanha (2005LEON, N.; PESSANHA, J. F. M. Dinâmica da evolução do consumo de energia no setor residencial. In: SEMINÁRIO NACIONAL DE PRODUÇÃO E TRANSMISSÃO DE ENERGIA ELÉTRICA, 18., Curitiba, 2005. Proceedings … Curitiba, 2005.), Lins (2010LINS, F. E. Demanda por energia elétrica residencial urbana no Brasil: uma análise baseada nos microdados das POFs 2002-2003 e 2008-2009. Recife, 2010. Tese (Doutorado em Economia) - Universidade Federal de Pernambuco, Recife, 2010. ) and Pessanha and Leon (2012PESSANHA, J.F.M.; LEON, N. Long-term forecasting of household and residential electric customers in Brazil. IEEE Latin America Transaction, v.10, n. 2, p.1537-1543, 2012.). On the other hand, there are also few approaches to the regional electricity consumption context, highlighting the studies of Almeida, Schaeffer and La Rovere (2001ALMEIDA, M. A.; SCHAEFFER, R.; LA ROVERE, E. L. The potential for electricity conservation and peak load reduction in the residential sector of Brazil. Energy, v. 26, n. 4, p. 413-429, 2001. ), Achão and Schaeffer (2009ACHÃO, C. C. L.; SCHAEFFER, R. Decomposition analysis of the variations in residential electricity consumption in Brazil for the 1980-2007 period: Measuring the activity, intensity and structure effects. Energy Policy, v. 37, p. 5208-5220, 2009.), and the more recent study of Abrahão and Souza (2021ABRAHÃO, K. C. F. J.; SOUZA, R. V. G. Estimativa da evolução do uso final de energia elétrica no setor residencial do Brasil por regiões geográficas. Ambiente Construído, Porto Alegre, 2021.). None of these studies comprise both approaches at the same time.
The aim of this study was, therefore, to investigate the drivers of the Brazilian residential electricity consumption growth between years of 2000 and 2018, on regional level, through the application of the Index Decomposition Analysis - IDA and Logarithmic Mean Divisia Index I- LMDI-I. To meet the purpose, three IDA models were specified, considering four effects to be investigated in each model: activity, structure, quality of life and purchasing power, and intensity. Thus, it is expected that the results of this study will contribute to future research focused on the Brazilian residential sector, and in addition, serve for the future energy planning, and for the construction, reformulation and detailing of energy efficiency policies devoted to the sector.
Theoretical framework
Faced with the challenge of understanding the residential electricity consumption growth in recent years, the literature has been detailing analyses by region, climates, and introducing demography aspects. The world population is in demographic transition, resulting from the declining rates of fertility and mortality, and an increase in longevity (LESTHAEGHE, 2014LESTHAEGHE, R. The second demographic transition: a concise overview of its development. Proceedings of the National Academy of Sciences of the United States of America, v. 111, n. 51, 18112-18115, 2014.; UNITED…, 2017UNITED NATIONS. Department of Economic and Social Affairs, Population Division. World Population Prospects: The 2017 Revision, Key Findings and Advance Tables. 2017. Working Paper No. ESA/P/WP/248.), not yet considering the mortality rates due to the COVID-19 pandemic, decreed in March of 2020 by the World Health Organization (WORLD…, 2020WORLD HEALTH ORGANIZATION. Coronavirus disease 2019 (COVID-19). Situation Report 51. Available at: https://www.who.int/docs/default-source/coronaviruse/situation-reports/20200311-sitrep-51-covid-19.pdf?sfvrsn=1ba62e57_10. Access in: 26 apr. 2020.
https://www.who.int/docs/default-source/...
). The period of reclusion and social distancing rules imposed on the world population, to control the pandemic, altered social routines and forms of work, estimating that there are impacts, still unknown, on residential electricity consumption. Recent studies indicate that residential electricity consumption varies according to population age (BARDAZZI; PAZIENZIA, 2020BARDAZZI, R.; PAZIENZA, M.G. When I was your age: generational effects on long-run residential energy consumption in Italy. Energy Research &Social Science, v. 70, 2020.; ESTIRI; ZAGHENI, 2019ESTIRI, H.; ZAGHENI, E. Age matters: aging and household energy demand in the United States. Energy Research and Social Science, v. 5, p. 62-70, 2019.; LIDDLE, 2014LIDDLE, B. Impact of population, age structure, and urbanization on carbon emission/energy consumption: evidence from macro-level, cross-country analyses. Population Environmental, v. 35, n. 3, p. 286-304, 2014., 2013LIDDLE, B. Population, affluence, and environmental impact across development: evidence from panel cointegration modeling. Environmental Modelling & Software, v. 40, p. 255-266, 2013., 2004LIDDLE, B. Demographic dynamics and per capita environmental impact: using panel regressions and household decompositions to examine population and transport. Population and Environment, v. 26, n. 1, 2004.; TSO; GUAN, 2014TSO, G. K. F.; GUAN, J. A multilevel regression approach to understand effects of environment indicators and household features on residential energy consumption. Energy ,v. 66, p. 722-731, 2014.; DEUTSCH; TIMPE, 2013DEUTSCH, M.; TIMPE, P. The effect of age on residential energy demand. In: EUROPEAN COUNCIL FOR AN ENERGY EFFICIENT ECONOMY SUMMER STUDY, Hyères, 2013. Proceedings … Hyères: ECEEE Summer Study, 2013.; BROUNEN; KOK; QUIGLEY, 2012BROUNEN, D.; KOK, N.;QUIGLEY, J. M. Residential energy use and conservation: economics and demographics. European Economic Review, 56, p.931-945, 2012. ; TONN; EISENBERG, 2006TONN, B.; EISENBERG, J. The aging US population and residential energy demand. Energy Policy , v. 35, p. 743-745, 2006.; O’NEIL; CHEN, 2002O’NEIL, B. C.; CHEN, B. S. Demographic determinants of household energy use in the United States. Population and Development Review, v. 28, p. 53-88, 2002.). Despite the differences in the sociocultural particularities, scenario aspects, and methods, some studies are in line verifying that population aging will affect the electricity consumption (BARDAZZI; PAZIENZIA, 2020BARDAZZI, R.; PAZIENZA, M.G. When I was your age: generational effects on long-run residential energy consumption in Italy. Energy Research &Social Science, v. 70, 2020.; BROUNEN; KOK; QUIGLEY, 2012BROUNEN, D.; KOK, N.;QUIGLEY, J. M. Residential energy use and conservation: economics and demographics. European Economic Review, 56, p.931-945, 2012. ; TONN; EISENBERG, 2006TONN, B.; EISENBERG, J. The aging US population and residential energy demand. Energy Policy , v. 35, p. 743-745, 2006.; LIDDLE, 2004LIDDLE, B. Demographic dynamics and per capita environmental impact: using panel regressions and household decompositions to examine population and transport. Population and Environment, v. 26, n. 1, 2004.;PESSANHA; LEON, 2015PESSANHA, J. F. M.; LEON, N. Forecasting long-term electricity demand in the residential sector. Population Environmental , v. 55, p. 529-538, 2015., 2012PESSANHA, J.F.M.; LEON, N. Long-term forecasting of household and residential electric customers in Brazil. IEEE Latin America Transaction, v.10, n. 2, p.1537-1543, 2012.). Considering demographic aspects in the residential consumption investigation, such as population age groups and cohorts, is relevant since consumption varies not only with age, but also with the stages of life (BARDAZZI; PAZIENZIA, 2020BARDAZZI, R.; PAZIENZA, M.G. When I was your age: generational effects on long-run residential energy consumption in Italy. Energy Research &Social Science, v. 70, 2020.; ESTIRI; ZAGHENI, 2019ESTIRI, H.; ZAGHENI, E. Age matters: aging and household energy demand in the United States. Energy Research and Social Science, v. 5, p. 62-70, 2019.; LIDDLE, 2014LIDDLE, B. Impact of population, age structure, and urbanization on carbon emission/energy consumption: evidence from macro-level, cross-country analyses. Population Environmental, v. 35, n. 3, p. 286-304, 2014.; PESSANHA; LEON, 2012PESSANHA, J.F.M.; LEON, N. Long-term forecasting of household and residential electric customers in Brazil. IEEE Latin America Transaction, v.10, n. 2, p.1537-1543, 2012.). The cohort analysis assumes that in each generation there is a change in the pattern of energy consumption, for example, two people at the age of 30, the first living in 1990, and the other living in 2018, in the same place, present different consumption patterns, due to the time in which they are living, and due the evolution of society, economy, appliance technology, among others. For this reason, it is important that residential electricity consumption studies consider demographic characteristics data of households, over the years, whenever possible. The methods can vary from the consideration of a population age structure to socio-demographic factors at the household level, where the latter, being more specific, is often not included in statistical surveys (LIDDLE, 2014LIDDLE, B. Impact of population, age structure, and urbanization on carbon emission/energy consumption: evidence from macro-level, cross-country analyses. Population Environmental, v. 35, n. 3, p. 286-304, 2014.; DEUTSCH; TIMPLE, 2013DEUTSCH, M.; TIMPE, P. The effect of age on residential energy demand. In: EUROPEAN COUNCIL FOR AN ENERGY EFFICIENT ECONOMY SUMMER STUDY, Hyères, 2013. Proceedings … Hyères: ECEEE Summer Study, 2013.).
Liddle (2011LIDDLE, B. Consumption-driven environmental impact and age structure change in OECD countries. Demographic Research, v.24, p. 749-770, 2011.) investigated residential electricity consumption for the Organization for Economic Cooperation and Development (OECD) countries pointing out that groups of young people (those with age of 20-34) and elderly (people over age of 70) have a positive relationship with consumption, while the median age groups (people with age of 35 to 69) have a negative relation. In a complementary way, but not contrary, Liddle and Lung (2010LIDDLE, B.; LUNG, S. Age-structure, urbanization, and climate change in developed countries: Revisiting STIRPAT for disaggregated population and consumption-related environmental impacts. Population Environmental , v. 31, p. 317-343, 2010.) point out that the active population, once they are the ones who generate wealth, have a positive and a more relevant relationship with electricity consumption than the gross domestic product.
According to some authors, the electricity demand increases with age, up to the age of 60, when the gradual reduction in the income of the elderly leads to a reduction in the electricity consumption to control expenses, added to the tendency of the elderly to have less electronic equipment (ESTIRI; ZAGHENI, 2019ESTIRI, H.; ZAGHENI, E. Age matters: aging and household energy demand in the United States. Energy Research and Social Science, v. 5, p. 62-70, 2019.; BROUNEN; KOK; QUIGLEY, 2012BROUNEN, D.; KOK, N.;QUIGLEY, J. M. Residential energy use and conservation: economics and demographics. European Economic Review, 56, p.931-945, 2012. ; LIDDLE; LUNG; 2010LIDDLE, B.; LUNG, S. Age-structure, urbanization, and climate change in developed countries: Revisiting STIRPAT for disaggregated population and consumption-related environmental impacts. Population Environmental , v. 31, p. 317-343, 2010.). Bardazzi and Pazienzia (2020BARDAZZI, R.; PAZIENZA, M.G. When I was your age: generational effects on long-run residential energy consumption in Italy. Energy Research &Social Science, v. 70, 2020.) found that the intensity of electricity use by technology and its availability lead the generations to increase the electricity consumption, including the elderly. However, the studies are convergent in the aspect of that consumption growth is controlled by income, climate, and physical characteristics of the household, and also, varying throughout the phases of life (BARDAZZI; PAZIENZIA, 2020BARDAZZI, R.; PAZIENZA, M.G. When I was your age: generational effects on long-run residential energy consumption in Italy. Energy Research &Social Science, v. 70, 2020.; ESTIRI; ZAGHENI, 2019; BROUNEN; KOK; QUIGLEY, 2012BROUNEN, D.; KOK, N.;QUIGLEY, J. M. Residential energy use and conservation: economics and demographics. European Economic Review, 56, p.931-945, 2012. ; LIDDLE; LUNG; 2010; O’NEIL; CHEN, 2002O’NEIL, B. C.; CHEN, B. S. Demographic determinants of household energy use in the United States. Population and Development Review, v. 28, p. 53-88, 2002.). Estiri and Zagheni (2019ESTIRI, H.; ZAGHENI, E. Age matters: aging and household energy demand in the United States. Energy Research and Social Science, v. 5, p. 62-70, 2019.) investigated residential electricity consumption in the United States considering population cohorts. The study pointed a peak consumption by the population aged of 30 to 55, and a downward trend in consumption by people between age of 60 and 70. The study also identified that neither income nor household variables have an impact on the consumption pattern by the young population. However, the study identified a reduction in electricity consumption from the population age of 19, considering that, from this age, the dependency rate of family income is reduced, and young adults begin to live in households with smaller area, adopting a more modest lifestyle to control expenses, which includes electricity. According to Bardazzi and Pazienzia (2020BARDAZZI, R.; PAZIENZA, M.G. When I was your age: generational effects on long-run residential energy consumption in Italy. Energy Research &Social Science, v. 70, 2020.), population dynamics and habits of energy consumption across different generations should be considered important determinants in future energy demand, since age and cohort effects play a significant role in this projection, especially in energy saving policy designs.
Drivers of residential electricity consumption
Several variables influence the growth of residential electricity consumption, positively or negatively, and with different intensities. Xu and Ang (2014XU, X.Y.; ANG, B.W. Analyzing residential energy consumption using index decomposition analysis. Applied Energy , v. 113, p. 342-351, 2014.) organized the variables reported by the literature that impact on residential electricity consumption, classifying them as direct and indirect. The study also identified that some of the variables can be measured (quantified), while others are difficult to measure. The following direct variables were raised: number of people per household, population, climatic conditions, equipment technology and ownership, and size of the household. As indirect variables, the following variables were raised: electricity tariff, household income, and individual factors, such as consumer awareness and behavior. The study also highlighted that household income was considered the most important indirect variable related to changes in electricity consumption by the residential sector.
The analysis of social processes has been progressively incorporated into energy studies, challenging energy policy makers to integrate social aspects in regulations and guidelines. Hamza and Gilroy (2011HAMZA, N.;GILROY, R. The challenge to UK energy policy: an aging population perspective on energy saving measures and consumption. Energy Policy , v. 39, p.782-789, 2011.) investigated the effect of population aging in the United Kingdom, indicating that the country's energy policies, aimed at reducing consumption, should consider the interrelation of 4 main factors: the diversity of population aging in relation to their income situation, the necessity of improvements in the thermal conditions of old homes, the changes that had been occurring in the energy matrix, and indicated the promotion of a society with lower consumption of services and goods related to leisure. As pointed out by Royston, Selby and Shove (2018ROYSTON S.; SELBY J.; SHOVE, E. Invisible energy policies: a new agenda for energy demand reduction. Energy Police, v. 123, p. 127-135, 2018.), the construction of policies aimed to reduce electricity consumption must go beyond the limits of energy policies, and towards non-energy policies, since the consumption is not only shaped by direct factors, but also by indirect factors, such as electricity tariff, household income, behavior, social and cultural historical constitution, among others.
The Brazilian residential sector
The Brazilian literature has an extensive investigation related to electricity consumption by residential sector. However, the dimension of the residential sector, and its physical, economic, cultural, and demographic characteristics, among others, causes complexity in the understanding of the consumption patterns by households. In this respect, the PPH 2019, a Survey on Ownership of Appliances and Consumption Habits (Pesquisa de Posse e Hábitos de Uso de Equipamentos Elétricos na Classe Residencial) (ELETROBRAS, 2019ELETROBRAS. Pesquisa de posse e hábitos de uso de equipamentos elétricos na Classe Residencial. Relatório Técnico 2019. 2019. Available at: Available at: https://eletrobras.com/pt/AreasdeAtuacao . Access in: 15 dec. 2019.
https://eletrobras.com/pt/AreasdeAtuacao...
) raised characteristics of households, appliance ownership and consumption habits, disaggregated by geographic regions. It is also noteworthy that this publication, differently from the previous survey from 2005, incorporated demography data of the household, such as the number of people by age group and by income class. However, the research brings data restricted to urban areas with 100,000 or more households, not including Brazilian rural households. It should also be highlighted that PPH surveys are being published in the country with a long interval of time, the last with an interval of 12 years, causing rupture for an analysis of annual consumption data.
Little is known about the relationship between population demographic processes and the residential electricity consumption in Brazil. Pessanha and Leon (2012PESSANHA, J.F.M.; LEON, N. Long-term forecasting of household and residential electric customers in Brazil. IEEE Latin America Transaction, v.10, n. 2, p.1537-1543, 2012., 2015PESSANHA, J. F. M.; LEON, N. Forecasting long-term electricity demand in the residential sector. Population Environmental , v. 55, p. 529-538, 2015.) estimated the projection of electricity demand by residential sector based on the development of a methodology for the projection of the household numbers, which considered the headship rate, age and gender of the population, among other socioeconomic data, in a national approach. The authors recommended future studies to incorporate demographic data and assumptions of electricity demand by residential sector, such as the effect of the population age transition. Lins (2010LINS, F. E. Demanda por energia elétrica residencial urbana no Brasil: uma análise baseada nos microdados das POFs 2002-2003 e 2008-2009. Recife, 2010. Tese (Doutorado em Economia) - Universidade Federal de Pernambuco, Recife, 2010. ) investigated the electricity consumption at the level of households, from econometric analyses of data from the Household Budget Survey (Pesquisa de Orçamentos Familiares- POF), for two periods, 2002-2003 and 2008-2009, incorporating the residents’ profiles, such as age, gender and schooling of the head of the family. Household income and regionality were identified as relevant aspects of influence over consumption, recommending that there should be a review of these aspects in energy policy. Therefore, it is reasonable to assume that electricity consumption indices should be different for Brazilian regions, as well as for population age groups, since culture, household income and lifestyle are variables that impact the patterns of electricity consumption differently (ABRAHÃO; SOUZA, 2021ABRAHÃO, K. C. F. J.; SOUZA, R. V. G. Estimativa da evolução do uso final de energia elétrica no setor residencial do Brasil por regiões geográficas. Ambiente Construído, Porto Alegre, 2021.; BOERI et al., 2020BOERI, A. et al. Future design approaches for energy poverty: users profiling and services for no-vulnerable condition. Energies, v.13, n. 8, 2020.; ESTIRI; ZAGHENI, 2019ESTIRI, H.; ZAGHENI, E. Age matters: aging and household energy demand in the United States. Energy Research and Social Science, v. 5, p. 62-70, 2019.; LIDDLE, 2014LIDDLE, B. Impact of population, age structure, and urbanization on carbon emission/energy consumption: evidence from macro-level, cross-country analyses. Population Environmental, v. 35, n. 3, p. 286-304, 2014.; TSO;GUAN, 2014TSO, G. K. F.; GUAN, J. A multilevel regression approach to understand effects of environment indicators and household features on residential energy consumption. Energy ,v. 66, p. 722-731, 2014.; LINS, 2010LINS, F. E. Demanda por energia elétrica residencial urbana no Brasil: uma análise baseada nos microdados das POFs 2002-2003 e 2008-2009. Recife, 2010. Tese (Doutorado em Economia) - Universidade Federal de Pernambuco, Recife, 2010. ; O’NEIL; CHEN, 2002O’NEIL, B. C.; CHEN, B. S. Demographic determinants of household energy use in the United States. Population and Development Review, v. 28, p. 53-88, 2002.).

Summarized information of studies in the context of the Brazilian residential electricity consumption
Table 1 presents summarized information of studies that investigated the electricity consumption by residential sector in Brazil, as well as the technique and the variables considered.
From Table 1, it is verified that few studies in the Brazilian literature present investigation of the consumption disaggregated by geographic region or an approach on demographic aspects. The difficulty to construct residential electricity consumption analysis based on household demographic variables in Brazil is related to the complexity in data gathering. In this sense, it is relevant to highlight the demography detailing of households published in the PPH 2019 survey (ELETROBRAS, 2019ELETROBRAS. Pesquisa de posse e hábitos de uso de equipamentos elétricos na Classe Residencial. Relatório Técnico 2019. 2019. Available at: Available at: https://eletrobras.com/pt/AreasdeAtuacao . Access in: 15 dec. 2019.
https://eletrobras.com/pt/AreasdeAtuacao...
), allowing what is expected to be an expansion and a further development of the literature with this approach. As shown in Table 1, it can be seen that there is an intense investigation related to the variables of households (H), household density (P/H) and income range (IR). The studies of Abrahão and Souza (2021ABRAHÃO, K. C. F. J.; SOUZA, R. V. G. Estimativa da evolução do uso final de energia elétrica no setor residencial do Brasil por regiões geográficas. Ambiente Construído, Porto Alegre, 2021.), Silva et al. (2014SILVA, A. S. et al. Knowing electricity end-uses to successfully promote energy efficiency in buildings: a case study in low-income houses in Southern Brazil. International Journal of Sustainable Energy Planning and Management, v. 2, p. 7-18, 2014.), Andrade and Pinheiro (2014ANDRADE, F. V.; PINHEIRO, R. B. Análise de decomposição da projeção de consumo residencial de energia elétrica no Brasil para o setor residencial. Engevista, v. 16, n. 4, p. 340-355, 2014.), Ghisi, Gosch and Lamberts (2007GHISI, E.; GOSCH, S.; LAMBERTS, R. Electricity end-uses in the residential sector of Brazil. Energy Policy , v. 35, n. 8, p. 789-202, 2007.), Januzzi and Schipper (1991JANUZZI, G. M.; SCHIPPER, L. The structure of electricity demand in the Brazilian household sector. Energy Policy , v. 19, n. 11, p. 879-891, 1991.) estimated the residential electricity consumption by end-use of appliances. The Brazilian heterogeneity was considered in the studies of Abrahão and Souza (2021ABRAHÃO, K. C. F. J.; SOUZA, R. V. G. Estimativa da evolução do uso final de energia elétrica no setor residencial do Brasil por regiões geográficas. Ambiente Construído, Porto Alegre, 2021.) and Almeida, Schaeffer and La Rovere (2001ALMEIDA, M. A.; SCHAEFFER, R.; LA ROVERE, E. L. The potential for electricity conservation and peak load reduction in the residential sector of Brazil. Energy, v. 26, n. 4, p. 413-429, 2001. ), which recognized regional aspects over consumption patterns, and a close relationship between consumption and regional climate. Leon and Pessanha (2005LEON, N.; PESSANHA, J. F. M. Dinâmica da evolução do consumo de energia no setor residencial. In: SEMINÁRIO NACIONAL DE PRODUÇÃO E TRANSMISSÃO DE ENERGIA ELÉTRICA, 18., Curitiba, 2005. Proceedings … Curitiba, 2005.) attributed the household income and electricity tariff as the key issue to explain the conditions of availability of family income for spending on electricity consumption. When public policies were addressed, Villareal and Moreira (2019VILLAREAL, M. J. C.; MOREIRA, J. M. L. Household consumption of electricity in Brazil between 1985 and 2013. Energy Policy , v. 96, p. 251-259, 2019.) identified that the policies for expanding access to electricity and for increasing energy efficiency in equipment had a small effect on electricity consumption, concluding that the variation in household numbers has greater contribution to consumption growth. Furthermore, and consistent with the study of Uhr, Chagas and Uhr (2019UHR, D. A. P.; CHAGAS, A. L. S.; UHR, J. Z. G. Estimations of elasticities for electricity demand in Brazilian households and policy implications. Energy Police, v. 129, p. 69-79, 2019.), family income was positively related to consumption, while the tariff presented a negative impact on the electricity consumption. This latest study also found that the raise in tariff affects households with low electricity consumption leading to a great restriction in consumption, situation that is in line with the concept of energy poverty (BOERI et al., 2020BOERI, A. et al. Future design approaches for energy poverty: users profiling and services for no-vulnerable condition. Energies, v.13, n. 8, 2020.). Abrahão and Souza (2021ABRAHÃO, K. C. F. J.; SOUZA, R. V. G. Estimativa da evolução do uso final de energia elétrica no setor residencial do Brasil por regiões geográficas. Ambiente Construído, Porto Alegre, 2021.) also raised public policies and programs implemented from the year of 2000 verifying diversified regional responses in the residential electricity consumption. The study verified that the residential sector still presents a high participation of consumption by equipment for Food Conservation, Water Heating, and Environmental Comfort, ranging together from 82 to 91% among regions, despite the evolution of end-use structure consumption over the years. The fact is that the Brazilian residential sector needs to intensify energy efficiency measures over appliance consumption, mainly focused on the replacement of lamps, shower heating systems, air conditioning and refrigerators (MORISHITA; GHISI, 2010MORISHITA, C.; GHISI, E. Assessment of the impact of energy-efficiency household appliances on the electricity consumption in the residential sector of Brazil. In: WORLD ENERGY COUNCIL CONGRESS, Montreal, 2010. Proceedings … Montreal: World Energy Council Congress, 2010.; ABRAHÃO; SOUZA, 2021ABRAHÃO, K. C. F. J.; SOUZA, R. V. G. Estimativa da evolução do uso final de energia elétrica no setor residencial do Brasil por regiões geográficas. Ambiente Construído, Porto Alegre, 2021.).
Method
Methodological reference
The formulation of indices is a method used even before the twentieth century, assisting in the theoretical analysis of quantities and values. Over the decades, index methodological procedures were developed based on the theories of the index numbers of Divisia and Laspeyres. Those methods mostly present equations of data derivation in continuous timeline, making it possible to compare groups of variables related to each other through the variations that occurred over time, evolving into detailing in additive and multiplicative forms.
Later, the methods of index formulation were recognized as methods of Index Decomposition Analysis - IDA (XIAOYAN, 2013XIAOYAN, X. Index decomposition analysis of energy consumption and carbon emissions: some methodological issues. Singapore, 2013. Doctoral Thesis - Department of Industrial and Systems Engineering, National University of Singapore, Singapore, 2013.). The IDA methods were basically divided into two groups:
-
methods associated with the Laspeyres index, and
-
methods associated with the Divisia index, as shown in Table 2.
The first studies on energy context with application of Index Decomposition Analysis emerged in the late 1970s (ANG, 2012ANG, B.W. A simple guide to LMDI decomposition analysis. Singapore: National University of Singapore, 2012.), and from the 1990s on some international agencies adopted them to quantify the main factors of influence on energy consumption. Through Table 2, it is observed that most methods present residue production in the results, and fail in the time reversion test, thus not being characterized as perfect decomposition methods. In general, these methods are used to explain changes in the behavior of an indicator, for example, consumption of electricity, at various levels denominated by determinants or effects: structure, activity and intensity. In addition, over the years, they have moved on to a trend of mathematical refinement, leading to a more intense use of perfect decomposition methods, such as LMDI (ANDRADE; PINHEIRO, 2014ANDRADE, F. V.; PINHEIRO, R. B. Análise de decomposição da projeção de consumo residencial de energia elétrica no Brasil para o setor residencial. Engevista, v. 16, n. 4, p. 340-355, 2014.; XIAOYAN, 2013XIAOYAN, X. Index decomposition analysis of energy consumption and carbon emissions: some methodological issues. Singapore, 2013. Doctoral Thesis - Department of Industrial and Systems Engineering, National University of Singapore, Singapore, 2013.; ANG, 2012ANG, B.W. A simple guide to LMDI decomposition analysis. Singapore: National University of Singapore, 2012.; ACHÃO; SCHAEFFER, 2009ACHÃO, C. C. L.; SCHAEFFER, R. Decomposition analysis of the variations in residential electricity consumption in Brazil for the 1980-2007 period: Measuring the activity, intensity and structure effects. Energy Policy, v. 37, p. 5208-5220, 2009.; ANG, 2004ANG, B. W. Decomposition analysis for policymaking in energy: which is the preferred method? Energy Policy , v. 32, p.1131-1139, 2004.).
Index Decomposition Analysis (IDA)
The Index Decomposition Analysis - IDA, a term coined by Ang and Zhang (2000ANG, B.W.; ZHANG, F. Q. A survey of index decomposition analysis in energy and environmental studies. Energy , v. 25, n. 12, p. 1149-1176, 2000.), is a widely used tool for analyzing changes in energy consumption over time. Basically, IDA starts from a set of energy consumption data, and disaggregated into levels, sectors, or regions, or by integrated factors such as social factors, e.g., population, households; physical factors, such as the location conditions of households; and economic factors, such as GDP, tariff and income. Thus, the method allows clarifying the mechanisms of changes in energy consumption in a sector, being useful for policy formulation and detailing (XU; ANG, 2014XU, X.Y.; ANG, B.W. Analyzing residential energy consumption using index decomposition analysis. Applied Energy , v. 113, p. 342-351, 2014.).

Studies of IDA can be found in Ang and Zhang (2000ANG, B.W.; ZHANG, F. Q. A survey of index decomposition analysis in energy and environmental studies. Energy , v. 25, n. 12, p. 1149-1176, 2000.), and Ang (2004ANG, B. W. Decomposition analysis for policymaking in energy: which is the preferred method? Energy Policy , v. 32, p.1131-1139, 2004.). Xu and Ang (2014XU, X.Y.; ANG, B.W. Analyzing residential energy consumption using index decomposition analysis. Applied Energy , v. 113, p. 342-351, 2014.) present a review of the literature using IDA, as well as the effects most explored by the literature in the context of residential energy consumption. IDA is used in studies related to energy efficiency by the International Energy Agency and the European Union, as well as in technical analyses to assess progress by the World Bank (ANG, 2015ANG, B.W. LMDI decomposition approach: a guide for implementation. Energy Policy , v. 86, p. 233-238, 2015.).
The large number of variables that influence the residential electricity consumption makes the task of electing an indicator to explain the activity effect complex. The activity effect should be considered one of the greatest aspects of relevance in the contribution of the variation of energy consumption (XU; ANG, 2014XU, X.Y.; ANG, B.W. Analyzing residential energy consumption using index decomposition analysis. Applied Energy , v. 113, p. 342-351, 2014.). After determining the variables and/or indicators to be considered for the analyses, an IDA must be specified, based on an equality equation.
Logarithmic Mean Divisia Index - LMDI
Once the IDA equation is specified, decomposition can be developed from the formulations of Logarithmic Mean Divisia Index (LMDI) technique. Ang (2004ANG, B. W. Decomposition analysis for policymaking in energy: which is the preferred method? Energy Policy , v. 32, p.1131-1139, 2004.) compared several studies of IDA, finding a preference among the publications raised related to the application of LMDI, mainly due to some recognized advantages: theoretical foundation; adaptability; easy application of formulations; the property of time reversal test; residue absence and easy interpretation of results (ANG, 2004ANG, B. W. Decomposition analysis for policymaking in energy: which is the preferred method? Energy Policy , v. 32, p.1131-1139, 2004., 2015ANG, B.W.; WANG, H. Index decomposition analysis with multidimensional and multilevel energy data. Energy Economics, v. 51, p. 67-76, 2015.; XIAOYAN, 2013XIAOYAN, X. Index decomposition analysis of energy consumption and carbon emissions: some methodological issues. Singapore, 2013. Doctoral Thesis - Department of Industrial and Systems Engineering, National University of Singapore, Singapore, 2013.).
Ang (2015ANG, B.W. LMDI decomposition approach: a guide for implementation. Energy Policy , v. 86, p. 233-238, 2015., 2005ANG, B. W. The LMDI approach to decomposition analysis: a practical guide. Energy Policy , v. 33, p. 867-871, 2005.) studies provide a practical guide for the specification of IDA and LMDI, respectively. The LMDI formulations can be made through additive or multiplicative forms, both with wide use by researchers and analysts (ANG; WANG, 2015ANG, B.W.; WANG, H. Index decomposition analysis with multidimensional and multilevel energy data. Energy Economics, v. 51, p. 67-76, 2015.). The additive form is based on the decomposition of the arithmetic variation of the aggregate, and the results are given in physical units. The multiplicative form is based on the decomposition of the change ratio, with results given in relative indices. Ang (2015ANG, B.W. LMDI decomposition approach: a guide for implementation. Energy Policy , v. 86, p. 233-238, 2015.) organized the formulations LMDI-I and LMDI-II in 4 models of additive and multiplicative forms, by two criteria to specify the activity effect:
-
decomposition of a variable, such as energy consumption; and
-
decomposition of an intensity indicator, such as energy intensity, e.g. consumption per person, or consumption per household, or consumption by another factor.
Ang (2015ANG, B.W. LMDI decomposition approach: a guide for implementation. Energy Policy , v. 86, p. 233-238, 2015.) also compared the formulations providing recommendations for their proper application. In Brazil, the studies of Andrade and Pinheiro (2014ANDRADE, F. V.; PINHEIRO, R. B. Análise de decomposição da projeção de consumo residencial de energia elétrica no Brasil para o setor residencial. Engevista, v. 16, n. 4, p. 340-355, 2014.), Achão and Schaeffer (2009ACHÃO, C. C. L.; SCHAEFFER, R. Decomposition analysis of the variations in residential electricity consumption in Brazil for the 1980-2007 period: Measuring the activity, intensity and structure effects. Energy Policy, v. 37, p. 5208-5220, 2009.), and Leon and Pessanha (2005LEON, N.; PESSANHA, J. F. M. Dinâmica da evolução do consumo de energia no setor residencial. In: SEMINÁRIO NACIONAL DE PRODUÇÃO E TRANSMISSÃO DE ENERGIA ELÉTRICA, 18., Curitiba, 2005. Proceedings … Curitiba, 2005.) applied the Logarithmic Mean Divisia Index - LMDI-I method with the aim to investigate the residential electricity consumption, with details of analysis already presented on Table 1.
Andrade and Pinheiro (2014ANDRADE, F. V.; PINHEIRO, R. B. Análise de decomposição da projeção de consumo residencial de energia elétrica no Brasil para o setor residencial. Engevista, v. 16, n. 4, p. 340-355, 2014.) determined the projection of the sector's energy consumption for the year 2020 indicating an 112% of growth index compared to 2005, although the level of consumption did not reach this rate until the year 2019, according to EPE (EMPRESA…, 2020EMPRESA DE PESQUISA ENERGÉTICA. Balanço Energético Nacional 2020: ano base 2019. Available at: http://www.epe.gov.br/pt/publicacoes-dados-abertos/publicacoes/balanco-energetico-nacional-2020. Access in: 29 dec. 2020.
http://www.epe.gov.br/pt/publicacoes-dad...
). The authors concludes that the increase in the household numbers (activity effect) was the factor of greatest impact in increasing consumption. Achão and Schaeffer (2009ACHÃO, C. C. L.; SCHAEFFER, R. Decomposition analysis of the variations in residential electricity consumption in Brazil for the 1980-2007 period: Measuring the activity, intensity and structure effects. Energy Policy, v. 37, p. 5208-5220, 2009.) observed that the increase in the number of households (activity effect) and the specific consumption of household appliances (intensity effect) were the main responsible for the variations of residential electricity consumption. The study also highlighted that the consumption shares by low-income consumers (structural effect) also influenced the variation of consumption by the sector, especially in the Northeast region, and immediately after the rationing of electricity, imposed by the National Government, occurred in 2001. It is also noteworthy that Achão and Schaeffer (2009ACHÃO, C. C. L.; SCHAEFFER, R. Decomposition analysis of the variations in residential electricity consumption in Brazil for the 1980-2007 period: Measuring the activity, intensity and structure effects. Energy Policy, v. 37, p. 5208-5220, 2009.) and Andrade and Pinheiro (2014ANDRADE, F. V.; PINHEIRO, R. B. Análise de decomposição da projeção de consumo residencial de energia elétrica no Brasil para o setor residencial. Engevista, v. 16, n. 4, p. 340-355, 2014.) recommended the production of studies of residential electricity consumption with regional approach analyses.
The following stages were developed in this work to explain the variation in electricity consumption by the residential sector, between the years of 2000 and 2018:
-
data collection, processing, organization and analysis;
-
IDA specification;
-
LMDI-I application; and
-
analysis and discussion of results.
Data collection, processing, organization and analyzes
Brazil is politically and geographically divided into five distinct regions(North, Northeast, Midwest, Southeast, and South) with varied physical, demographic, and socioeconomic characteristics. In this study, data were collected from official sources disaggregated by regions. Assuming that there are n factors that can contribute to changes in residential electricity consumption over time, this study selected the following variables: household numbers, population, electricity tariff, gross domestic product - GDP and minimum wage, as the driver aspects of the consumption variation to be investigated, as identified in the literature, and presented in the theoretical framework, assuming all other factors being constant (ceteris paribus). The year of 2000 was determined as the beginning of the analysis since it is the mark of a structural change of the Brazilian Electric Sector. The analysis lasted until the year 2018, because this was the year of the last publication of regional GDP data by the Brazilian Institute of Geography and Statistics, at the beginning of this study. Therefore, the impacts of reclusion and social distancing rules due to the COVID-19 pandemic over residential electricity consumption will not be addressed by the present study.
The annual data of residential electricity consumption for 2000 and 2018, accumulated in December of each year, were collected from EPE (EMPRESA…, 2019bEMPRESA DE PESQUISA ENERGÉTICA. Mercado Mensal para download: consumo mensal de energia elétrica por classe, Brasil e regiões. Available at: http://www.epe.gov.br/pt/publicacoes-dados-abertos/publicacoes/consumo-de-energia-eletrica. Access in: 15 dec. 2019b.
http://www.epe.gov.br/pt/publicacoes-dad...
).
GDP, Tariff and Minimum Wage (MW)
In this study, gross domestic product and national minimum wage were respectively expressed by GDP and MW. GDP, electricity tariff and MW are indirect variables impacting on electricity consumption, also considered in the literature, especially in the construction of consumption scenarios (XU; ANG, 2014XU, X.Y.; ANG, B.W. Analyzing residential energy consumption using index decomposition analysis. Applied Energy , v. 113, p. 342-351, 2014.; VILLAREAL; MOREIRA, 2019VILLAREAL, M. J. C.; MOREIRA, J. M. L. Household consumption of electricity in Brazil between 1985 and 2013. Energy Policy , v. 96, p. 251-259, 2019.). This study collected regional data of GDP and tariff, and national data of minimum wage, the latter with value established by the National Government. The GDP in Brazil is an economic indicator with annual measurement of all production of goods and services, including a portion that represents access to credit for individuals, signaling the purchasing power of households by facilitated credit. In developing countries, such as Brazil, policies for credit access and interest rates reduction positively influence residential electricity consumption by promoting the acquisition of appliances and electronics, mainly by low-income families (ABRAHÃO; SOUZA, 2021ABRAHÃO, K. C. F. J.; SOUZA, R. V. G. Estimativa da evolução do uso final de energia elétrica no setor residencial do Brasil por regiões geográficas. Ambiente Construído, Porto Alegre, 2021.; WOLFRAM; SHELEF; GERTLER, 2012WOLFRAM, C.; SHELEF, O.; GERTLER, P. How will energy demand develop in the developing world? Journal of Economic Perspectives, v. 26, n.1, p. 119-138, 2012.; ACHÃO; SCHAFFER, 2009ACHÃO, C. C. L.; SCHAEFFER, R. Decomposition analysis of the variations in residential electricity consumption in Brazil for the 1980-2007 period: Measuring the activity, intensity and structure effects. Energy Policy, v. 37, p. 5208-5220, 2009.). The accumulated annual data of GDP were collected from IBGE (INSTITUTO…, 2020aINSTITUTO BRASILEIRO DE GEOGRAFIA E ESTATÍSTICA. Sistema de contas nacionais trimestrais: downloads: Produto Interno Bruto (valores correntes) - Brasil, grandes regiões. Available at: https://www.ibge.gov.br/estatisticas/economicas/contas-nacionais/9054-contas-regionais-do-brasil.html?=&t=downloads. Access in: 15 oct. 2020a.
https://www.ibge.gov.br/estatisticas/eco...
). The annual data of MW were collected from Ipeadata (2020IPEADATA. Salário mínimo mensal vigente: 1940-2019. Available at: http://www.ipeadata.gov.br/ExibeSerie.aspx?stub=1&serid1739471028=1739471028. Access in: 15 jan. 2020.
http://www.ipeadata.gov.br/ExibeSerie.as...
), while the average annual value data of residential electricity tariff were collected from ANEEL (AGÊNCIA…, 2020bAGÊNCIA NACIONAL DE ENERGIA ELÉTRICA. Tarifa média (R$/MWh) por classes de consumo e por regiões geográficas do Brasil 2003-2020. Available at: http://relatorios.aneel.gov.br/_layouts/xlviewer.aspx?id=/RelatoriosSAS/RelSampRegCC.xlsx&Source=http://relatorios.aneel.gov.br/RelatoriosSAS/Forms/AllItems.aspx&DefaultItemOpen=1. Access in: 15 apr. 2020b.
http://relatorios.aneel.gov.br/_layouts/...
) and Brazil (2005BRAZIL. Câmara dos Deputados. Consultoria Legislativa, Brasília, DF, 2005. Francisco José Rocha de Sousa. A evolução das tarifas de energia elétrica e do salário mínimo. Available at: Available at: http://www2.camara.leg.br/a-camara/documentos-e-pesquisa/estudos-e-notas-tecnicas/areas-da-conle/tema16/2005_14301.pdf . Access in: 15 Jul. 2017.
http://www2.camara.leg.br/a-camara/docum...
).
The data of tariff, GDP and MW, in real values, suffered fluctuations, valuations and devaluations through the economic and political actions during the period (2000-2018). Thus, in order to make the comparison procedures of the actual nominal values in the temporal analyses appropriate, the nominal data of tariff, GDP and MW were deflated in real values, using the year of 2000 as the base year. The deflation procedure was carried out through the National Index of Consumer Prices - IPCA, collected from IBGE (INSTITUTO…, 2019INSTITUTO BRASILEIRO DE GEOGRAFIA E ESTATÍSTICA. Sidra - Banco de tabelas estatísticas. Economia. Índice Nacional de Preços ao Consumidor Amplo - IPCA. Tabela 1737: IPCA - Série histórica com número-índice, variação mensal e variações acumuladas em 3 meses, em 6 meses, no ano e em 12meses (a partir de dezembro/1979). Available at: https://sidra.ibge.gov.br/pesquisa/snipc/ipca/tabelas/brasil/dezembro-2020. Access in: 15 oct. 2019.
https://sidra.ibge.gov.br/pesquisa/snipc...
) which is the official index of the Brazilian Government for measuring inflationary targets, and is also used for the correction of GDP in all regions, referring to the accumulated index in December of each year (CARRARA; CORREA, 2012CARRARA, A. F.; CORREA, A. L. O regime de metas de inflação no Brasil: uma análise empírica do IPCA. Revista Economia Contemporânea, Rio de Janeiro, v.16, n.3, p. 441-462, set./dez. 2012. ).
Equation 1 presents the formulation for determining the deflation indicator for the years 2001 to 2018.
Where:
d expresses the indicator of deflation; t expresses the year 2000;
n =1, 2, 3, ... 18 and expresses the years of 2001 to 2018;
a expresses the accumulated IPCA index for the month of December of each year, for the years of 2001 to 2018.
This study considered the year of 2000 as the base year, thus, implying on the equivalence of d t = d 2000 = 1.
Equation 2 presents the formulation for determining the actual value of the tariff, GDP and MW data, into all data deflated.
Where:
X´ (R$): deflated annual data - tariff, GDP, MW;
j= 1, 2, 3, 4 and 5: Brazilian geographic regions;
t: 2000; n =1, 2, 3, ... 18: years 2001 to 2018;
X (R$): annual amount in nominal value of tariff, GDP and MW; and
d: deflation indicator for the years 2001 to 2018.
From the equivalence consideration of d 2000 = 1, it is inferred that X´ 2000 = X 2000 , i.e. the nominal value of the data (tariff; GDP; MW) for the year 2000 was not deflated.
Household
Since the urbanization process is associated with economic growth, the greatest household growth rates occurs in urban environments estimating a higher electricity consumption by urban households, but not as a rule. Jorgenson, Rice and Clark (2010JORGENSON, A.; RICE, J.; CLARK, B. Cities, slums, and energy consumption in less developed countries, 1990 to 2005. Organization and Environment, v. 23, n. 2, p. 189-204, 2010.) pointed out that urbanization has a positive and significant influence on electricity consumption, although this relationship becomes negative, even significant, in Brazilian households located in slums and clusters of urban areas, due to the situation of poverty and precarious housing. Liddle (2014LIDDLE, B. Impact of population, age structure, and urbanization on carbon emission/energy consumption: evidence from macro-level, cross-country analyses. Population Environmental, v. 35, n. 3, p. 286-304, 2014.) considered that urban households contribute more to the growth of consumption than rural households, mainly by the greater ownership of appliances and technologies that provide services to households through electricity consumption. However, estimates of consumption by rural households isolated from agriculture and livestock activities are not known in Brazil.
Another aspect is related to the evolution of demographic density, which in recent years has been showing a drop in the number of people per household, and a trend of growth of single-person households, which positively impacts the consumption due to the reduction in the sharing of household appliances (INSTITUTO…, 2014INSTITUTO BRASILEIRO DE GEOGRAFIA E ESTATÍSTICA. Síntese de Indicadores Sociais: uma análise das condições de vida da população Brasileira 2013. Rio de Janeiro, 2014.; ABRAHÃO; SOUZA, [2021ABRAHÃO, K. C. F. J.; SOUZA, R. V. G. Estimativa da evolução do uso final de energia elétrica no setor residencial do Brasil por regiões geográficas. Ambiente Construído, Porto Alegre, 2021.]).
This study estimated the effect on the variation of electricity consumption by households, according to the area of location, and according to income ranges. In this study, households refer to household numbers in the National Household Sample Survey (PesquisaNacional de Amostra de Domicílios - PNAD) described as "households with electric lighting", that is, with access to electricity, and collected from IBGE (INSTITUTO…, 2020cINSTITUTO BRASILEIRO DE GEOGRAFIA E ESTATÍSTICA. Pesquisa Nacional por Amostra de Domicílios - PNAD - 1999: grandes regiões. Available at: https://www.ibge.gov.br/estatisticas/sociais/habitacao/9127-pesquisa-nacional-por-amostra-de-domicilios.html?=&t=downloads. Access in: 15 jan. 2020c.
https://www.ibge.gov.br/estatisticas/soc...
, 2020dINSTITUTO BRASILEIRO DE GEOGRAFIA E ESTATÍSTICA. Pesquisa Nacional por Amostra de Domicílios - PNAD - 2001: grandes regiões. Available at: https://www.ibge.gov.br/estatisticas/sociais/habitacao/9127-pesquisa-nacional-por-amostra-de-domicilios.html?=&t=downloads. Access in: 15 jan. 2020d.
https://www.ibge.gov.br/estatisticas/soc...
, 2020eINSTITUTO BRASILEIRO DE GEOGRAFIA E ESTATÍSTICA. Pesquisa Nacional por Amostra de Domicílios - PNAD: downloads - grandes regiões. Available at: https://www.ibge.gov.br/estatisticas/sociais/trabalho/17270-pnad-continua.html?=&t=downloads. Access in: 15 jan. 2020e.
https://www.ibge.gov.br/estatisticas/soc...
). These represent approximately 97.4% of the total number of households in Brazil - rural households in the North region are not being considered (INSTITUTO…, 2020eINSTITUTO BRASILEIRO DE GEOGRAFIA E ESTATÍSTICA. Pesquisa Nacional por Amostra de Domicílios - PNAD: downloads - grandes regiões. Available at: https://www.ibge.gov.br/estatisticas/sociais/trabalho/17270-pnad-continua.html?=&t=downloads. Access in: 15 jan. 2020e.
https://www.ibge.gov.br/estatisticas/soc...
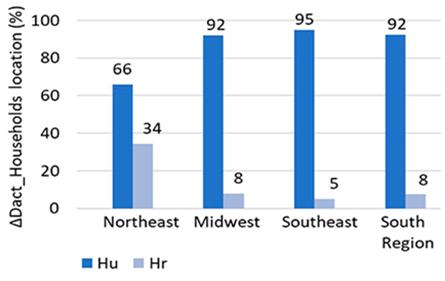
). The households, expressed by H, were analyzed for their area of location, urban and rural, expressed by Hu and Hr, respectively.
The analysis of households was also disaggregated into income ranges. The PNAD survey disaggregates household data by income class as follows: up to 1 minimum wage (MW), from 1 to 2 MW, from 2 to 3 MW, from 3 to 5 MW, from 5 to 10 MW, from 10 to 20 MW, above 20 MW, without income statement, and incomeless. Households classified as incomeless include households where residents receive only social benefits promoted by the Government, such as the BolsaFamília program and the Benefits of Continued Provision (Retirement and Social Assistance). In this study, households were grouped into 3 income groups. The first group, expressed by H0-2MW, brings together households with income up to 2 MW, incorporating households without income statement and incomeless. The second and third groups, expressed by H2-5MW and H5+MW, refer to households with income range from 2 to 5 minimum wages, and households with income above 5 MW, respectively.
Household numbers for the year 2000 were estimated from the average data from the years of 1999 and 2001 because there is no data available from PNAD surveys during the years in which Brazilian census were carried out, i.e., years of 2000 and 2010.
Electricity consumption by household
It is noteworthy that, despite the availability of rural and urban household numbers, there is an unavailability of average annual household electricity consumption data, which partially impacts the refinement of the analyses. For this reason, this study considered equivalence in the consumption by urban and rural household located in the same region. Thus, the household location analyses will be sensitive because of the household stock variations.
It was necessary to estimate the average annual household electricity consumption disaggregated by household income ranges, given their unavailability. Average monthly electricity consumption was collected by economic class of households by region, from PPH 2019 (ELETROBRAS, 2019ELETROBRAS. Pesquisa de posse e hábitos de uso de equipamentos elétricos na Classe Residencial. Relatório Técnico 2019. 2019. Available at: Available at: https://eletrobras.com/pt/AreasdeAtuacao . Access in: 15 dec. 2019.
https://eletrobras.com/pt/AreasdeAtuacao...
), estimating the average annual household consumption by income class. As the income classes of the households of the PPH 2019 survey are different from the income ranges of the household groups in this study, an equivalence of income between them was determined, as shown in Table 3, through the Brazil 2018 criterion established by ABEP (ASSOCIAÇÃO…, 2020ASSOCIAÇÃO DE EMPRESAS DE PESQUISA. Critério de classificação econômica Brasil - 2018. Available at: https://www.abep.og/criterio-Brazil. Access: 08 apr. 2020.
https://www.abep.og/criterio-Brazil...
), still considered according to Abrahão and Souza (2021ABRAHÃO, K. C. F. J.; SOUZA, R. V. G. Estimativa da evolução do uso final de energia elétrica no setor residencial do Brasil por regiões geográficas. Ambiente Construído, Porto Alegre, 2021.).
The value of the monthly minimum wage of the year 2018, correspondent to R$ 954.00, was considered to estimates the income range equivalence (IPEADATA, 2020IPEADATA. Salário mínimo mensal vigente: 1940-2019. Available at: http://www.ipeadata.gov.br/ExibeSerie.aspx?stub=1&serid1739471028=1739471028. Access in: 15 jan. 2020.
http://www.ipeadata.gov.br/ExibeSerie.as...
). The equivalence between the household groups from PPH and this study allowed to estimate the proportion of the average monthly electricity consumption per household and by income range. The average monthly consumption of the household groups by income range by region are presented in Results section.
The characteristics and analysis of the PPH 2019 survey sampling plan can be found in Eletrobras (2019ELETROBRAS. Pesquisa de posse e hábitos de uso de equipamentos elétricos na Classe Residencial. Relatório Técnico 2019. 2019. Available at: Available at: https://eletrobras.com/pt/AreasdeAtuacao . Access in: 15 dec. 2019.
https://eletrobras.com/pt/AreasdeAtuacao...
) and Abrahão and Souza (2021ABRAHÃO, K. C. F. J.; SOUZA, R. V. G. Estimativa da evolução do uso final de energia elétrica no setor residencial do Brasil por regiões geográficas. Ambiente Construído, Porto Alegre, 2021.), respectively.
Population
The Brazilian population is in process of aging. Between years 2000 and 2018, the Brazilian population increased at an annual average geometric growth rate of 1.4%, while population age of 60 and above increased at a rate of 3.6%. In rural areas, this growth is more intense due to the urbanization process, which lead the young people, living in rural areas, to migrate to urban environments, in search of better living conditions, education and employability (MAIA; BUAINAIN, 2015MAIA, A. G.; BUAINAIM, A. M. O novo mapa da população rural Brasileira. Confins, v. 25, 2015.). Hence, the urbanization process is contributing to decrease the rates of household density in rural areas.
The dynamics of the population aging process is different by region. In 2010, there was already a higher regional share of the elderly population (age of 60 and above) in rural areas when compared to urban ones, especially in the Midwest, Southeast and South regions. The South region, for example, showed that the share of 14% of the rural population was elderly in 2010, while in urban areas this share was equivalent to 12%. This dynamics of rural areas is leading household income to a greater dependence on social benefits paid by the Government, such as Retirement and Social Assistance, thus estimating an impact on electricity consumption (INSTITUTO…, 2020fINSTITUTO BRASILEIRO DE GEOGRAFIA E ESTATÍSTICA. Sidra - Banco de tabelas estatísticas. População. Tabela 1378: população residente, por situação do domicílio, sexo e díade, segundo a condição no domicílio e comportamento da responsabilidade pelo domicílio. Available at: https://sidra.ibge.gov.br/pesquisa/censo-demografico/demografico-2010/universo-caracteristicas-da-populacao-e-dos-domicilios. Access in: 15 Jan. 2020f.
https://sidra.ibge.gov.br/pesquisa/censo...
). Urban areas of the Southeast and Midwest regions, concentrated 93 and 89% of the total regional population in 2010, while urban areas of the North and Northeast regions, with lower dynamics of urbanization process, concentrated respectively, 74 and 73% (INSTITUTO…, 2020fINSTITUTO BRASILEIRO DE GEOGRAFIA E ESTATÍSTICA. Sidra - Banco de tabelas estatísticas. População. Tabela 1378: população residente, por situação do domicílio, sexo e díade, segundo a condição no domicílio e comportamento da responsabilidade pelo domicílio. Available at: https://sidra.ibge.gov.br/pesquisa/censo-demografico/demografico-2010/universo-caracteristicas-da-populacao-e-dos-domicilios. Access in: 15 Jan. 2020f.
https://sidra.ibge.gov.br/pesquisa/censo...
).
The urbanization processes and the natural demographic dynamics have been intensifying, requiring new demands for services in urban areas, and presenting new challenges for policies, including ones related to energy, and requiring innovations in all segments (VERAS, 2009VERAS, R. Population aging today: demands, challenges and innovations. Revista Saúde Pública, v. 43, n. 3, 2009. ). The population contingent aged 60 years and above represented 8% of the total population in 2000, rising to 13% in 2018, and projected to share of 19% in 2030. The North region still has a young population, in which only 12% will be aged 60 and older in 2030, compared to the proportion of 21% and 22% of elderly people in the Southeast and South regions, respectively (INSTITUTO…, 2020bINSTITUTO BRASILEIRO DE GEOGRAFIA E ESTATÍSTICA. Projeções da População por sexo e idade - Brasil: 2000-2060 e Unidades da Federação - 2000-2030. Available at: https://www.ibge.gov.br/estatisticas/sociais/populacao/9109-projecao-da-populacao.html?edicao=9116&t=resultados. Access in:15 jan. 2020b.
https://www.ibge.gov.br/estatisticas/soc...
). One of the concerns with the process of population aging is related to the expansion of the dependency rate of the non-economically active population, such as children and part of the elderly, by the working-age population, which generates income and wealth, overloading the payment of retirement benefits by the National Government in addition to other public services. For this reason, among other economic issues, since 2019 the Brazilian Government has been preparing a proposal for Social Security reform, which may imply in an extension of the economic and productive activity of some age groups, and thus estimating to affect the relationship with residential consumption.
The tendency to the urban way of life, the low levels of occupation and the lack of accessibility in the immediate areas of the homes, and the health conditions usually lead the elderly to spend more time at home, watching television and using electrical appliances at home. In addition, elderlies present a more difficult mobility rate with 33% of this population age group having reported to have permanent difficulty in walking without care (INSTITUTO…, 2014INSTITUTO BRASILEIRO DE GEOGRAFIA E ESTATÍSTICA. Síntese de Indicadores Sociais: uma análise das condições de vida da população Brasileira 2013. Rio de Janeiro, 2014.). Spending more time at home, allowed by income conditions, these people tend to maintain rates of consumption of services related to the comfort of the previous phase of their lives (in an economically active situation). Conversely, the elderly who did not establish themselves economically face problems related to spending on food and drug consumption, and basic services such as the electricity bill (ZANON; MORETTO; RODRIGUES, 2014ZANON, R. R.; MORETTO, A. C.; RODRIGUES, R. L. Aging of population and changes in consumption patterns: impacts on the production structure in Brazil. Revista Brasileira de Estudos de População, v. 30, p. S45-S67, 2014.; TURRA; QUEIROZ, 2007TURRA, C. M.; QUEIROZ, B. L. Before it’s too late: demographic transition, labour supply, and social security problems in Brazil. United Nations Expert Group Meeting on Social and Economic Implications of Changing Population Age Structures. 2007. Available at: Available at: https://www.un.org/en/development/desa/population/publications/pdf/aging/egm-mex-turra.pdf . Access in: 15 dec. 2018.
https://www.un.org/en/development/desa/p...
). This situation has led young people to an early insertion in work, especially in the category of informality, incorporating a relevant contribution in family income at home, especially in the North and Northeast regions. According to IBGE (INSTITUTO…, 2014INSTITUTO BRASILEIRO DE GEOGRAFIA E ESTATÍSTICA. Síntese de Indicadores Sociais: uma análise das condições de vida da população Brasileira 2013. Rio de Janeiro, 2014.), approximately 60% of Brazilian workers enter the labor market at the age of 15. Additionally, the dependence of the elderly has also led active people to work more hours daily, or taking on more work shifts, soon spending more hours working, to provide economic support and care for elderly parents or family members (PEREIRA JUNIOR et al., 2011PEREIRA JUNIOR, A. O. et al. Strategies to promote renewable energy in Brazil. Renewable and Sustainable Energy Reviews, v. 15, p. 681-688, 2011.).
In this study, the population data was based on the last two and most recent Census surveys conducted in Brazil, respectively in 2000 and 2010, and their projections. Annual population data were collected from IBGE (INSTITUTO…,2020bINSTITUTO BRASILEIRO DE GEOGRAFIA E ESTATÍSTICA. Projeções da População por sexo e idade - Brasil: 2000-2060 e Unidades da Federação - 2000-2030. Available at: https://www.ibge.gov.br/estatisticas/sociais/populacao/9109-projecao-da-populacao.html?edicao=9116&t=resultados. Access in:15 jan. 2020b.
https://www.ibge.gov.br/estatisticas/soc...
), disaggregated by geographic region. To refine the analysis of the contribution of the population's effect on the variation of residential electricity consumption, this study divided and organized the population into four age groups, respectively:
-
people from 0 to 14 years, (P0-14), representing all those under 15 years of age;
-
people between 15 and 34 years old (P15-34);
-
people between 35 and 59 years old (P35-59); and
-
people of ages 60 and above (P60+).
Population group of P0-14
The population group denoted by P0-14 represents a group of children up to the age of 14, who generally do not have financial autonomy and are dependent on adults. On the other hand, in low-income families, these children are usually motivated to an early insertion in the labor market to contribute to family income. In 2015, 34% of the Brazilian population declared to have started working activities between the ages of 10 and 14 (INSTITUTO…, 2016INSTITUTO BRASILEIRO DE GEOGRAFIA E ESTATÍSTICA. Pesquisa Nacional de Amostra de Domicílios - Síntese de Indicadores 2015. Rio de Janeiro, 2016.). A particularity of this group is that only 20% of children in the North and Northeast regions remain in school for more than 4 hours a day, while in the Midwest, Southeast and South regions this rate varies between 50 and 70% (INSTITUTO…, 2003INSTITUTO BRASILEIRO DE GEOGRAFIA E ESTATÍSTICA. Pesquisa Nacional de Amostra de Domicílios: trabalho infantil 2001. Rio de Janeiro, 2003., 2014INSTITUTO BRASILEIRO DE GEOGRAFIA E ESTATÍSTICA. Síntese de Indicadores Sociais: uma análise das condições de vida da população Brasileira 2013. Rio de Janeiro, 2014.). The influence of this population group on the electricity consumption is related to the time they spend at home, the energy consumption by this factor being also dependent on the household devices and appliance ownership. At home, the activity of this population age group is assumed to be related to performing school activities, preparing food and feeding, hygiene and leisure activities, and collaborating in household tasks. The electricity consumption analyses are, therefore, based on the consideration that most of these people are active in the use of electricity within the home, by sharing the use of household appliances, such as refrigerators, and by activating appliances, such as television, lighting, sockets for charging batteries of games and electronic devices, among others.
Population group of P15-34
The second group, denoted by P15-34, concentrates young individuals, including the first stage of insertion in the formal labor market, of age 15 to 34. This age group comprises young people that access the National Program for Access to Technical Education and Employment - PRONATEC, aimed at people aged 16 (BRAZIL, 2011BRAZIL. Lei nº 12.513, de 26 de outubro de 2011.Institui o Programa Nacional de Acesso ao Ensino Técnico e Emprego (Pronatec); altera as Leis nº 7.998, de 11 de janeiro de 1990, que regula o Programa do Seguro-Desemprego, o Abono Salarial e institui o Fundo de Amparo ao Trabalhador (FAT), nº 8.212, de 24 de julho de 1991, que dispõe sobre a organização da Seguridade Social e institui Plano de Custeio, nº 10.260, de 12 de julho de 2001, que dispõe sobre o Fundo de Financiamento ao Estudante do Ensino Superior, e nº 11.129, de 30 de junho de 2005, que institui o Programa Nacional de Inclusão de Jovens (ProJovem); e dá outras providências. Diário Oficial da União , Brasília, DF, 27 out. 2011. Available at: Available at: http://www.planalto.gov.br/ccivil_03/_ato2011-2014/2011/lei/l12513.htm . Access in: 15 Jan. 2020.
http://www.planalto.gov.br/ccivil_03/_at...
), and a group that also aligns with the National Program for the Inclusion of Youth - Projovem, aimed at people aged between 15 and 29, since the Youth Statute defines this age as young within the national context (BRAZIL, 2008BRAZIL. Lei nº 11.692, de 10dejunho de 2008.Dispõe sobre o Programa Nacional de Inclusão de Jovens - Projovem, instituído pela Lei no11.129, de 30 de junho de 2005; altera a Lei no10.836, de 9 de janeiro de 2004; revoga dispositivos das Leis nos9.608, de 18 de fevereiro de 1998, 10.748, de 22 de outubro de 2003, 10.940, de 27 de agosto de 2004, 11.129, de 30 de junho de 2005, e 11.180, de 23 de setembro de 2005; e dá outras providências. Diário Oficial da União , Brasília, DF, 11 jun. 2008. Available at: Available at: http://www.planalto.gov.br/ccivil_03/_ato2007-2010/2008/lei/l11692.htm . Access in: 15 Jan. 2020.
http://www.planalto.gov.br/ccivil_03/_at...
, 2011BRAZIL. Lei nº 12.513, de 26 de outubro de 2011.Institui o Programa Nacional de Acesso ao Ensino Técnico e Emprego (Pronatec); altera as Leis nº 7.998, de 11 de janeiro de 1990, que regula o Programa do Seguro-Desemprego, o Abono Salarial e institui o Fundo de Amparo ao Trabalhador (FAT), nº 8.212, de 24 de julho de 1991, que dispõe sobre a organização da Seguridade Social e institui Plano de Custeio, nº 10.260, de 12 de julho de 2001, que dispõe sobre o Fundo de Financiamento ao Estudante do Ensino Superior, e nº 11.129, de 30 de junho de 2005, que institui o Programa Nacional de Inclusão de Jovens (ProJovem); e dá outras providências. Diário Oficial da União , Brasília, DF, 27 out. 2011. Available at: Available at: http://www.planalto.gov.br/ccivil_03/_ato2011-2014/2011/lei/l12513.htm . Access in: 15 Jan. 2020.
http://www.planalto.gov.br/ccivil_03/_at...
, 2013BRAZIL. Lei nº 11.852, de 05 de agosto de 2013. Institui o Estatuto da Juventude e dispõe sobre os direitos dos jovens, os princípios e diretrizes das políticas públicas de juventude e o Sistema Nacional de Juventude. Diário Oficial da União , Brasília, DF, 6 ago. 2013. Available at: Available at: http://www.planalto.gov.br/ccivil_03/_ato2011-2014/2013/lei/l12852.htm . Access in: 15 Jan. 2020.
http://www.planalto.gov.br/ccivil_03/_at...
). These two national programs are of voluntary adherence, and stimulate the early insertion of young people in the labor market, making them part of the economically active population, proposing to provide better education, technical qualification and an opportunity to build a future financial autonomy. Therefore, it is hypothesized that the P15-34 group is formed by people who have access and autonomy for the purchase of goods, and thus, actively participate in family expenses at home. This group includes young people, students, part-time and full-time workers, who spend most of their time away from home, studying, working, in leisure activities, and commuting (walking, public transportation, private or other).
Population group of P35-59
The third group, denoted by P35-59, comprises the population of ages 35 to 39, and is characterized by individuals in a secondary stage of work, economically active people, such as people of the group P15-39, but that are more mature. These people are considered adults, and spend a lot of time away from home, working, studying and commuting. Thus, it is estimated that they have control over the consumption of goods, such as household appliances, as well as over family expenses. The age cut in this group was made according to the National Law of the Elderly, which defines elderly people as individuals aged 60 years or older (BRAZIL, 2003BRAZIL. Lei no 10.741 de 1o de outubro de 2003 - Dispõe sobre o Estatuto do Idoso e dá outras providências. Diário Oficial da União, Brasília, DF, 3 out. 2003. Available at: Available at: http://www.planalto.gov.br/ccivil_03/leis/2003/L10.741.htm . Access in: 15 Jan. 2018.
http://www.planalto.gov.br/ccivil_03/lei...
).
Population group of P60+
The fourth age group, denoted by P60+, is the group of the elderly, characterized by retired individuals and/or in tertiary work stage with age 60 and above. The Retirement Law establishes a minimum of 60 and 65 years of age, respectively for women and men, to require the assistance of the official retirement provided by the Government, once they meet specific criteria related to working time (BRAZIL, 1995BRAZIL. Lei nº 9.032, de 28 de abril de 1995. Dispõe sobre o valor do salário mínimo, altera dispositivos das Leis nº 8.212 e nº 8.213, ambas de 24 de julho de 1991, e dá outras providências. Diário Oficial da União , Brasília, DF, 28 abr. 1995. Available at: Available at: http://www.planalto.gov.br/ccivil_03/Leis/L9032.htm . Access in: 15 Jun. 2018.
http://www.planalto.gov.br/ccivil_03/Lei...
). In 2015, in Brazil, people aged 60 and above represented 7.5% of all economically active people older than age 15; a rate of 48.7% in the 21.6 million retired people still performed some economic activity or occupation (INSTITUTO…, 2016INSTITUTO BRASILEIRO DE GEOGRAFIA E ESTATÍSTICA. Pesquisa Nacional de Amostra de Domicílios - Síntese de Indicadores 2015. Rio de Janeiro, 2016., 2020bINSTITUTO BRASILEIRO DE GEOGRAFIA E ESTATÍSTICA. Projeções da População por sexo e idade - Brasil: 2000-2060 e Unidades da Federação - 2000-2030. Available at: https://www.ibge.gov.br/estatisticas/sociais/populacao/9109-projecao-da-populacao.html?edicao=9116&t=resultados. Access in:15 jan. 2020b.
https://www.ibge.gov.br/estatisticas/soc...
).
Electricity consumption by population age group
In this study, with the aim of analyzing the effect of population age groups on the variation of electricity consumption, it was necessary to estimate the average annual consumption of electricity by population age group. This study collected regional data on the average monthly household consumption disaggregated by economic class, and the number of people by household by age group by income range, from the PPH 2019 (ELETROBRAS, 2019ELETROBRAS. Pesquisa de posse e hábitos de uso de equipamentos elétricos na Classe Residencial. Relatório Técnico 2019. 2019. Available at: Available at: https://eletrobras.com/pt/AreasdeAtuacao . Access in: 15 dec. 2019.
https://eletrobras.com/pt/AreasdeAtuacao...
) to estimate proportionally the average annual electricity consumption of the population by age group by geographic region. Once the age groups of PPH 2019 are different from the age groups determined in this study, the equivalence between them was determined, as shown on Table 4. This way, it was possible to estimate the proportion of electricity consumption disaggregated by population age group, by region.
Presentation of the collected and processed data
Table 5 gathers the collected and processed data, organized by regions from the years 2000 and 2018, as the basis of the decomposition analysis purpose.
Data Analysis
Statistical analysis of mean (μ) and standard deviation (σ), which provides the aspects related to the midpoint and the dispersion, and the skewness (v) and kurtosis (k), which provided aspects related to the shape of data distribution were conducted for the panel data set on regional level for the period 2000 to 2018. In addition, an analysis of the Pearson correlation matrix and the corresponding p-value (probability of the correlation statistics) were developed to investigate the degree of linear relationship and level of significance between the variables of electricity consumption (C), tariff (Tar) and minimum wage (MW) and all the variables. Statistical analyses were developed through the Minitab software (MINITAB, 2010MINITAB. Minitab 17 Statistical Software. State College: Minitab, 2010.).
Index Decomposition Analysis (IDA)
The specification of decomposition index is set for each study, according to its objectives, and according to the availability of data that limits its applicability.
Equation 3AGÊNCIA NACIONAL DE ENERGIA ELÉTRICA. Informações técnicas: consumidores ano 2018. Available at: https://www2.aneel.gov.br/area.cfm?idArea=550. Access in: 15 apr. 2020a.
https://www2.aneel.gov.br/area.cfm?idAre...
presents index decomposition, developed by Ang, Zhang and Choi (1998ANG, B. W.; ZHANG, F.O.; CHOI, K. H. Factorizing changes in energy and environmental indicator through decomposition. Energy , v. 33, p. 489-495, 1998.).
Where:
E: total energy consumption;
(i) levels or sectors of analysis;
Q(=ΣiQi ): activity effect;
Si (=Q i /Q): structure effect; and
Ii (=E i /Q i ): intensity effect.
According to the authors, the analysis factors or effects can be modified, reduced or expanded, since the Identity Equation results in equality or equivalence.
From Equation 3, the study proposes a new IDA detailed on Equation 4, adding one more index (quality of life and purchasing power effect) to expand the analysis and maintaining the equality property.
As explained, in this study irefers to the residential sector and j refers to the Brazilian geographic regions.
Where:
C: electricity consumption;
A: activity effect;
S(=Sji/Aji ): structure effect;
Q(=Qji/Sji ): quality of life and purchasing power effect; and
Ii (=C ji /Q ji ): intensity effect.
Based on the terms of Equation 4, four effects were determined for analysis, which are: activity (A), structure (S), quality of life and purchasing power (Q), and intensity (I). Three models of index decomposition identity were determined, as shown in Table 6. For each model, one variable was determined for the analysis of the contribution as the activity effect (A). All models considered only one level of disaggregation of consumption referring to the regional level.
Table 6 briefly presents the variables, indicators and effects in the three index decomposition identity models of this study. For each of the models, a variable was determined for the activity effect - A, starting from the consideration that the indicator of this effect should be taken as a factor of relevant contribution in the variation of electricity consumption (XU; ANG, 2014XU, X.Y.; ANG, B.W. Analyzing residential energy consumption using index decomposition analysis. Applied Energy , v. 113, p. 342-351, 2014.). Thus, the following variables were selected for the activity effect in model of 1, 2 and 3, respectively: households - H, population - P, and tariff - Tar. In Model 1, where household numbers were specified as activity effect, the influence of the variation of household location area (urban and rural) was also considered in relation to the three level of income ranges of households. In Model 2, where population were specified as activity effect, the influence of population age groups on the variation of electricity consumption was also analyzed.
Decomposition formulation of LMDI
Once the identity of the IDA was specified, decomposition analysis was developed from the additive formulation of the Logarithmic Mean Divisia Index I (LMDI-I) method, formulated by Ang et al. (1998ANG, B. W.; ZHANG, F.O.; CHOI, K. H. Factorizing changes in energy and environmental indicator through decomposition. Energy , v. 33, p. 489-495, 1998.). The LMDI additive form provides the results in absolute values, and has some advantages such as the simpler application than the multiplicative formulation, and the possibility of converting absolute values results into relative values, if desired. In this study, Equations 5 to 9, developed by Ang, Zhang and Choi (1998ANG, B. W.; ZHANG, F.O.; CHOI, K. H. Factorizing changes in energy and environmental indicator through decomposition. Energy , v. 33, p. 489-495, 1998.), were adapted for the IDA identity function. Equation 5 presents the decomposition formulation in additive form. The subscribed terms act, str, qual and int, denote the effects associated with activity, structure, quality of life and purchasing power, and intensity, respectively.
Where:
ΔC J (MWh): variation in electricity consumption by residential sector;
CjT (MWh): residential electricity consumption of the year 2018;
Cj0 (MWh), residential electricity consumption of the year 2000;and
ΔD J, decomposition of consumption through each of the effects described above.
The details of the effects for Models 1 to 3, were presented in Table 6.
Equation 6 presents the decomposition of the activity effect, and adapted to the IDA identity function of this study.
Where:
ΔD jact: activity effect of decomposition consumption;
CjT (MWh): residential electricity consumption of the year 2018;
Cj0 (MWh): residential electricity consumption of the year 2000;
AjT: activity effect by the indicator for the year of 2018; and
Aj0: activity effect by the indicator for the year of 2000.
Equation 7 presents the formulation of the structure effect decomposition, and adapted to the IDA identity function of this study.
Where:
ΔD jstr: structure effect of decomposition consumption;
CjT (MWh): residential electricity consumption of the year 2018;
Cj0 (MWh): residential electricity consumption of the year 2000;
SjT :structure effect by the indicator for the year of 2018; and
Sj0: structure effect by the indicator for the year of 2000.
Equation 8 presents the formulation of the quality of life and purchase power effect of decomposition consumption, and adapted to the IDA identity function of this study.
Where:
ΔD j qua : quality of life and purchase power effect of decomposition consumption;
CjT: (MWh): residential electricity consumption of the year 2018;
Cj0: (MWh): residential electricity consumption of the year 2000;
QjT: quality of life and purchase power effect by the indicator for the year of 2018; and
Qj0: quality of life and purchase power effect by the indicator for the year of 2000.
Equation 9 presents the formulation of the intensity effect decomposition, and adapted to the IDA identity function of this study.
Where:
ΔD j qua : intensity effect of decomposition consumption;
CjT: (MWh): residential electricity consumption of the year 2018;
Cj0: (MWh): residential electricity consumption of the year 2000;
IjT: intensity effect by the indicator for the year of 2018; and
Ij0: intensity effect by the indicator for the year of 2000.
Results
Drivers of electricity consumption
Firstly, the results describe the evolution pattern analysis of the variables selected in this study as the drivers of electricity consumption by Brazilian residential sector:
-
Gross Domestic Product - GDP;
-
Tariff; Minimum wage (MW);
-
Households; and
-
Population.
Figure 1 presents the pattern of variables from national level of minimum wage, average electricity tariff, and GDP. Figures 2, 3, 4, 5 and 6 present the regional evolutionary profile of data of residential electricity consumption, households, population, GDP and tariff, between the years 2000 and 2018. As explained, the data of tariff, GDP and MW were deflated in real values, using the year 2000 as the base year.
GDP, Electricity tariff and Minimum wage (MW)
Figure 1 shows that the national minimum wage - MW evolved parallel to the national GDP, while the evolution of the tariff, after the year of 2006, grew in indices lower than the GDP and MW. Thus, there is an appreciation of the MW in relation to the tariff. As estimated in the consumption projections of Villareal and Moreira (2019VILLAREAL, M. J. C.; MOREIRA, J. M. L. Household consumption of electricity in Brazil between 1985 and 2013. Energy Policy , v. 96, p. 251-259, 2019.), the values practiced by the tariff in recent years contributed to boost the consumption of electricity, however, the growth in the tariff has the effect of reducing consumption. In this sense, the authors pointed out that the tariff policy may be used to control the consumption growth (VILLAREAL; MOREIRA, 2019VILLAREAL, M. J. C.; MOREIRA, J. M. L. Household consumption of electricity in Brazil between 1985 and 2013. Energy Policy , v. 96, p. 251-259, 2019.).

Source: prepared by the authors from EPE (EMPRESA…,2019bEMPRESA DE PESQUISA ENERGÉTICA. Mercado Mensal para download: consumo mensal de energia elétrica por classe, Brasil e regiões. Available at: http://www.epe.gov.br/pt/publicacoes-dados-abertos/publicacoes/consumo-de-energia-eletrica. Access in: 15 dec. 2019b.
http://www.epe.gov.br/pt/publicacoes-dad...
), IBGE (INSTITUTO…, 2020aINSTITUTO BRASILEIRO DE GEOGRAFIA E ESTATÍSTICA. Sistema de contas nacionais trimestrais: downloads: Produto Interno Bruto (valores correntes) - Brasil, grandes regiões. Available at: https://www.ibge.gov.br/estatisticas/economicas/contas-nacionais/9054-contas-regionais-do-brasil.html?=&t=downloads. Access in: 15 oct. 2020a.
https://www.ibge.gov.br/estatisticas/eco...
, 2020bINSTITUTO BRASILEIRO DE GEOGRAFIA E ESTATÍSTICA. Projeções da População por sexo e idade - Brasil: 2000-2060 e Unidades da Federação - 2000-2030. Available at: https://www.ibge.gov.br/estatisticas/sociais/populacao/9109-projecao-da-populacao.html?edicao=9116&t=resultados. Access in:15 jan. 2020b.
https://www.ibge.gov.br/estatisticas/soc...
, 2020cINSTITUTO BRASILEIRO DE GEOGRAFIA E ESTATÍSTICA. Pesquisa Nacional por Amostra de Domicílios - PNAD - 1999: grandes regiões. Available at: https://www.ibge.gov.br/estatisticas/sociais/habitacao/9127-pesquisa-nacional-por-amostra-de-domicilios.html?=&t=downloads. Access in: 15 jan. 2020c.
https://www.ibge.gov.br/estatisticas/soc...
, 2020eINSTITUTO BRASILEIRO DE GEOGRAFIA E ESTATÍSTICA. Pesquisa Nacional por Amostra de Domicílios - PNAD: downloads - grandes regiões. Available at: https://www.ibge.gov.br/estatisticas/sociais/trabalho/17270-pnad-continua.html?=&t=downloads. Access in: 15 jan. 2020e.
https://www.ibge.gov.br/estatisticas/soc...
), ANEEL (AGÊNCIA…, 2020bAGÊNCIA NACIONAL DE ENERGIA ELÉTRICA. Tarifa média (R$/MWh) por classes de consumo e por regiões geográficas do Brasil 2003-2020. Available at: http://relatorios.aneel.gov.br/_layouts/xlviewer.aspx?id=/RelatoriosSAS/RelSampRegCC.xlsx&Source=http://relatorios.aneel.gov.br/RelatoriosSAS/Forms/AllItems.aspx&DefaultItemOpen=1. Access in: 15 apr. 2020b.
http://relatorios.aneel.gov.br/_layouts/...
) and Brazil (2005BRAZIL. Câmara dos Deputados. Consultoria Legislativa, Brasília, DF, 2005. Francisco José Rocha de Sousa. A evolução das tarifas de energia elétrica e do salário mínimo. Available at: Available at: http://www2.camara.leg.br/a-camara/documentos-e-pesquisa/estudos-e-notas-tecnicas/areas-da-conle/tema16/2005_14301.pdf . Access in: 15 Jul. 2017.
http://www2.camara.leg.br/a-camara/docum...
).
Electricity consumption (GWh), households (1,000 units), population (1,000 units), GDP (R$ 1,000,000) and electricity tariff (R$/GWh) - 2000-2018 by region
Households
As presented, the growth in the household numbers is one of the most investigated variables within the context of residential electricity consumption. Household growth index differs between regions and, which according to Abrahão and Souza ([2021ABRAHÃO, K. C. F. J.; SOUZA, R. V. G. Estimativa da evolução do uso final de energia elétrica no setor residencial do Brasil por regiões geográficas. Ambiente Construído, Porto Alegre, 2021.]), is due to the public housing deficit reduction program, among other factors. Figures 2, 3, 4, 5 and 6 show that the profile growth of consumption and household numbers are rather similar, except in the South region, where household growth rates were lower than consumption. Household growth rates of the North and Southeast regions exceeded the growth rates of electricity consumption between years of 2000 and 2018. On the other hand, the increase in householdsnumbers was higher in the Southeast and Northeast regions, corresponding to 10.8 and 9.5 millions, respectively. Despite the small increase of households in the North Region (4.1 millions) compared to the Southeast and Northeast regions, their electrified households tripled, being the highest rate of household growth among the regions, while the Midwest region (2.5 millions) presented the lowest rate (INSTITUTO…, 2020cINSTITUTO BRASILEIRO DE GEOGRAFIA E ESTATÍSTICA. Pesquisa Nacional por Amostra de Domicílios - PNAD - 1999: grandes regiões. Available at: https://www.ibge.gov.br/estatisticas/sociais/habitacao/9127-pesquisa-nacional-por-amostra-de-domicilios.html?=&t=downloads. Access in: 15 jan. 2020c.
https://www.ibge.gov.br/estatisticas/soc...
, 2020dINSTITUTO BRASILEIRO DE GEOGRAFIA E ESTATÍSTICA. Pesquisa Nacional por Amostra de Domicílios - PNAD - 2001: grandes regiões. Available at: https://www.ibge.gov.br/estatisticas/sociais/habitacao/9127-pesquisa-nacional-por-amostra-de-domicilios.html?=&t=downloads. Access in: 15 jan. 2020d.
https://www.ibge.gov.br/estatisticas/soc...
, 2020eINSTITUTO BRASILEIRO DE GEOGRAFIA E ESTATÍSTICA. Pesquisa Nacional por Amostra de Domicílios - PNAD: downloads - grandes regiões. Available at: https://www.ibge.gov.br/estatisticas/sociais/trabalho/17270-pnad-continua.html?=&t=downloads. Access in: 15 jan. 2020e.
https://www.ibge.gov.br/estatisticas/soc...
).
Population
As observed through Figures 2, 3, 4, 5 and 6, the growth rates of the Brazilian population show little difference between regions. During the period, the North and Midwest regions presented the highest relative population increase, corresponding to 37%, while the othersshowed an increase of 18% (INSTITUTO…, 2020bINSTITUTO BRASILEIRO DE GEOGRAFIA E ESTATÍSTICA. Projeções da População por sexo e idade - Brasil: 2000-2060 e Unidades da Federação - 2000-2030. Available at: https://www.ibge.gov.br/estatisticas/sociais/populacao/9109-projecao-da-populacao.html?edicao=9116&t=resultados. Access in:15 jan. 2020b.
https://www.ibge.gov.br/estatisticas/soc...
). Population growth by age group is diversified among regions, and the advance of demographic transition process is observed in the most economically developed regions: the Southeast; Midwest and South.
Data analyses
In summary, the study constructed a panel data set comprising 1406 observations from 5 regions for the period of 2000 to 2018. Table 7 presents the summary statistics for the variables in logarithms.
Analyses of the Pearson correlation and the corresponding p-value matrix showed a strong and positive correlation between variables of electricity consumption (C), tariff (Tar) and minimum wage (MW) and others, with few exceptions presented in Table 8, and related to variables of H5+MW and P0-14.
Average monthly electricity consumption of households by income range, by region: 2018
Figures 3 and 4 show the average number of households and the resulting average electricity consumption per household by income range, respectively, by region, for the year of 2018.
Figure 3 shows a greater proportion of household income range of H0-2MW in the North and Northeast regions. Although this household group presented the lower rates of average consumption between the groups, as shown in Figure 4, the high proportion of households causes their consumption to be relevant in these regions. As expected, the Midwest, Southeast and South regions presented higher proportions of H2-5MW and H5+MW, and a high average consumption rate per household. The three levels of consumption by household income range, as seen in Figure 4, show a small variation in average consumption between regions, within the same household income range. It is also observed that H2-5MW and H5+MW from North and Northeast regions, presented one of the highest consumptions between regions, which leads to believe that the household income has no control over consumption in hot climate regions, except in low-income households, such as H0-2MW. These analyses are also consistent with the results of Almeida, Schaeffer and La Rovere (2001ALMEIDA, M. A.; SCHAEFFER, R.; LA ROVERE, E. L. The potential for electricity conservation and peak load reduction in the residential sector of Brazil. Energy, v. 26, n. 4, p. 413-429, 2001. ), and Ghisi, Gosch and Lamberts (2007GHISI, E.; GOSCH, S.; LAMBERTS, R. Electricity end-uses in the residential sector of Brazil. Energy Policy , v. 35, n. 8, p. 789-202, 2007.), who identified a positive relationship between residential electricity consumption and climate conditions. The results are also consistent with Abrahão and Souza ([2021ABRAHÃO, K. C. F. J.; SOUZA, R. V. G. Estimativa da evolução do uso final de energia elétrica no setor residencial do Brasil por regiões geográficas. Ambiente Construído, Porto Alegre, 2021.]), who estimated that low-income conditions still limit the ownership and degree of use of air conditioning in North and Northeast households. A small proportion of H5+MW households in the North and Northeast regions and a significant electricity consumption are observed, which lead to estimate that it is due to the use of air conditioning systems by these households. This analysis is consistent with Abrahão and Souza (2021ABRAHÃO, K. C. F. J.; SOUZA, R. V. G. Estimativa da evolução do uso final de energia elétrica no setor residencial do Brasil por regiões geográficas. Ambiente Construído, Porto Alegre, 2021.) that, in the North and Northeast regions, the use of air conditioning occurs throughout the year, and consistent with the sensitivity of electricity consumption to climate, pointed by Estiri and Zagheni (2019ESTIRI, H.; ZAGHENI, E. Age matters: aging and household energy demand in the United States. Energy Research and Social Science, v. 5, p. 62-70, 2019.), which, on the contrary, verified a higher energy consumption in the cold climate for the study of the residential sector in the United States, probably due to a high system usage.
Average monthly electricity consumption by population age groups, by region: year 2019
Figures 5 and 6 show the average estimative of population proportion by age groups, and the results of the average estimative of electricity consumption by age groups, by region, respectively.


Average estimative of electricity consumption per household by income range in minimum wage by region: year 2018 (%)


Average estimative of electricity consumption by population age groups by region: year of 2018 (%)
Figure 5 shows the population age groups during the year of 2018 and, unprecedentedly, Figure 6 presents the estimation of electricity consumption by population age groups, regionally. Considering the effect of a demographic transition process, with a trend of reduction in the proportion of the young population (P0-14 and P15-34 age groups) and a growth in the proportion of the adult and elderly population (P35-59 and P60+ age groups), more advanced levels of this process can be seen in the Southeast and South regions. The largest proportion of population are seen in P15-34 and P35-59 age groups in all regions, which also presented the highest average consumption rates (Figure 6), except for the South region. It is estimated that these two groups, that encompass economically active people, have greater decision-making power over the ownership and over equipment use rate at home. Peaks and consumption patterns by population age group were different among regions, especially in the Southern region. Consistent with Estiri and Zagheni (2019ESTIRI, H.; ZAGHENI, E. Age matters: aging and household energy demand in the United States. Energy Research and Social Science, v. 5, p. 62-70, 2019.) and O’Neil and Chen (2002O’NEIL, B. C.; CHEN, B. S. Demographic determinants of household energy use in the United States. Population and Development Review, v. 28, p. 53-88, 2002.), electricity consumption also grows with age, probably due to an expectation of increase in income. However, there is a drop in the consumption by the elderly group. In the South region, the consumption showed little variation by population age group, between 21.9% (P60+) and 28.5% (P0-14). Furthermore, the elderly group of South region presented a mean consumption more than two times greater than other regions (Figure 6). There is a trend of consumption growth towards the age group of P0-14 to P15-34 group, and a sharp reduction in consumption between groups of P35-59 and P60+. The group of children (P0-14) showed relevant consumption, consistent with Liddle (2011LIDDLE, B. Consumption-driven environmental impact and age structure change in OECD countries. Demographic Research, v.24, p. 749-770, 2011.). Conversely, the low level consumption by the elderly age group (P60+), except in the South region, differs from the results of Liddle (2011LIDDLE, B. Consumption-driven environmental impact and age structure change in OECD countries. Demographic Research, v.24, p. 749-770, 2011.) and Estiri and Zagheni (2019ESTIRI, H.; ZAGHENI, E. Age matters: aging and household energy demand in the United States. Energy Research and Social Science, v. 5, p. 62-70, 2019.), what is presumed to be due to the differences in the economic situation and quality of life between the Brazilian regions, and among the population of Brazil and United States. Thus, the lower electricity consumption by elderly group may be related to a phase of life with income reduction, consistent with Liddle and Lung (2010LIDDLE, B.; LUNG, S. Age-structure, urbanization, and climate change in developed countries: Revisiting STIRPAT for disaggregated population and consumption-related environmental impacts. Population Environmental , v. 31, p. 317-343, 2010.), Brounen, Kok and Quigley (2012BROUNEN, D.; KOK, N.;QUIGLEY, J. M. Residential energy use and conservation: economics and demographics. European Economic Review, 56, p.931-945, 2012. ), and Estiri and Zagheni (2019ESTIRI, H.; ZAGHENI, E. Age matters: aging and household energy demand in the United States. Energy Research and Social Science, v. 5, p. 62-70, 2019.), leading to restrict the expenses such as electricity consumption. In this sense, it is estimated that the proposal of Social Security reform in Brazil, which is considering an age dilation for retirement, leading to a need of the elderly population to extend their working age, which can mean the improvement of income of people in the aging phase of life, should positively impact the electricity consumption. In addition, the elderly population group is presenting an accelerated growth that should be considered when estimating aging impact. The findings that residential electricity consumption varies according to the population age are convergent with the studies of Estiri and Zagheni (2019ESTIRI, H.; ZAGHENI, E. Age matters: aging and household energy demand in the United States. Energy Research and Social Science, v. 5, p. 62-70, 2019.), Liddle (2014LIDDLE, B. Impact of population, age structure, and urbanization on carbon emission/energy consumption: evidence from macro-level, cross-country analyses. Population Environmental, v. 35, n. 3, p. 286-304, 2014., 2013LIDDLE, B. Population, affluence, and environmental impact across development: evidence from panel cointegration modeling. Environmental Modelling & Software, v. 40, p. 255-266, 2013., 2004LIDDLE, B. Demographic dynamics and per capita environmental impact: using panel regressions and household decompositions to examine population and transport. Population and Environment, v. 26, n. 1, 2004.), Tso and Guan (2014TSO, G. K. F.; GUAN, J. A multilevel regression approach to understand effects of environment indicators and household features on residential energy consumption. Energy ,v. 66, p. 722-731, 2014.), Deutsch and Timpe (2013DEUTSCH, M.; TIMPE, P. The effect of age on residential energy demand. In: EUROPEAN COUNCIL FOR AN ENERGY EFFICIENT ECONOMY SUMMER STUDY, Hyères, 2013. Proceedings … Hyères: ECEEE Summer Study, 2013.), Pessanha and Leon (2015PESSANHA, J. F. M.; LEON, N. Forecasting long-term electricity demand in the residential sector. Population Environmental , v. 55, p. 529-538, 2015., 2012PESSANHA, J.F.M.; LEON, N. Long-term forecasting of household and residential electric customers in Brazil. IEEE Latin America Transaction, v.10, n. 2, p.1537-1543, 2012.), Brounen, Kok and Quigley (2012BROUNEN, D.; KOK, N.;QUIGLEY, J. M. Residential energy use and conservation: economics and demographics. European Economic Review, 56, p.931-945, 2012. ), Tonn and Eisenberg (2006TONN, B.; EISENBERG, J. The aging US population and residential energy demand. Energy Policy , v. 35, p. 743-745, 2006.) and O’Neil and Chen (2002O’NEIL, B. C.; CHEN, B. S. Demographic determinants of household energy use in the United States. Population and Development Review, v. 28, p. 53-88, 2002.).
Results of decomposition analysis of electricity consumption
The variation in the residential electricity consumption by region, between the years 2000 and 2018, was analyzed in this study based on the determination of an Index Decomposition Identity Equation, and the application of the LMDI-1 method in its additive form. The index decomposition identity in this study was specified with four effects: activity (A), structure (S), quality of life and purchasing power (Q), and intensity (I). Three index decomposition identity models were elaborated for each region. The activity effect (A) in each model corresponded to: household (H), population (P), and tariff (Tar). The other effects, S, Q and I, were specified from indicators that included the variables of consumption (C), gross domestic product (GDP) and minimum wage (MW), the following being: P/H, C/H, C/GDP, H/GDP, GDP/P, GDP/MW and MW/Tar. Details of decomposition models, effects and variables can be seen on Table 6. Figures 7, 8, 9, 10 and 11 gather the decomposition results of the variation in residential electricity consumption by region, through Models 1, 2 and 3, enabling a comparative analysis. Figures 12 and 13 present the decomposition results of the effect A (H) in the Model 1, in terms of the variation of consumption by household income ranges and variation by the household location (urban and rural), respectively. Figure 14 presents the decomposition results of the effect A (P) in Model 2 in terms of the variation of consumption by population age groups. For a better understanding, the results were discussed by the models in the following sections.
Model 1
In Model 1, through Figures 7a, 8a, 9a, 10a, 11a and 12, it was observed that the negative and positive properties of the four effects were similar between regions, except for the intensity effect [I (C/GDP)] in the North region. The results showed that activity and quality of life and purchase power effects, respectively denoted by A (H) and Q (GDP/P), were the most significant, with a positive impact on consumption variation.

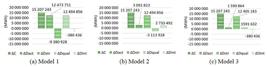
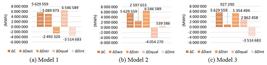


The activitybeffect [A (H)] in the North and Southeast regions was higher than the variation in energy consumption, observing that the higher contribution in these regions was by the lowest income households (Figure 12). In the Southeast region, households of H0-2MWand H2-5MW presented the same contribution given by the activityeffect. It is observed that the negative effect of H5+MW in the Southeast region is due to the migration of these households to lower income ranges, and thus, implying in a reduction in the variation of total household consumption, probably due to income restriction. Regarding location area, as shown on Figure 13, the contribution of households to the variation in consumption in urban areas was above 90%, except in the Northeast region. As already said, due to lack of data, rural households in the North region were not analyzed, and for the other regions, equality in electricity consumption in urban and rural households was considered. However, the contribution of urban households may be even greater, based on the consideration of Liddle (2014LIDDLE, B. Impact of population, age structure, and urbanization on carbon emission/energy consumption: evidence from macro-level, cross-country analyses. Population Environmental, v. 35, n. 3, p. 286-304, 2014.), who points out that urban households have a tendency of higher consumption per household, compared to rural households.
The household numbers have grown in all regions, although presenting reduction in the rate of people per household, leading to a slowdown in the variation in electricity consumption, which is the interpretation of the negative structure effect [S (P/H)]. The structure effect was more relevant in the North and Southeast than in other regions, i.e., a smaller number of people per household living in these regions decelerate the growth of consumption more than in other regions. Despite a lower share of appliance at home, it is also believed that households with fewer people, and associated with less favorable income conditions, have greater control over electricity expenditures.
The intensity effect [I (C/GDP)] showed a relevant and negative contribution to the variation in consumption in the Midwest and Southeast regions, whereas it was negligible in the North and Northeast regions.
Model 2
In Model 2, the decomposition of activity and structureeffects, respectively denoted by [A (P)] and [S (GDP/P)], showed positive properties in all regions, the latter being the most relevant to impulse the consumption, especially in the Midwest (116%) and Southeast (151%) regions (Figures 7b, 8b, 9b, 10b and 11b). Thus, it is interpreted that the increase of GDP in relation to the population contingent drives electricity consumption to an increase. The quality of life and purchase power effect [Q (H/GDP)] was positive only in the North region, while the intensity effect [I (C/H)] showed a small contribution in the regions, being negative in the North and Southeast regions.
Through Figure 14, it was verified that only the age group of P0-14 had significant and negative impact on the variation in consumption, except in the North and Midwest regions, where it showed to be insignificant. The age group of P35-59 presented greater contribution in the acceleration of electricity consumption in all regions, except in the North, where it had a similar contribution between the groups of P15-34 and P35-59. These results reveal that, in general, the working-age population, that works and generates income, boosts electricity consumption. It was also verified that the South region, in a more advanced state of the population aging process, compared to the other regions, presented relevant and the greater contribution of the elderly group within the activity effect [A (P)] analysis in the variation of consumption. Thus, this result can point to an alignment to the proposition of the studies of Brounen, Kok and Quigley (2012BROUNEN, D.; KOK, N.;QUIGLEY, J. M. Residential energy use and conservation: economics and demographics. European Economic Review, 56, p.931-945, 2012. ), Tonn and Eisenberg (2006TONN, B.; EISENBERG, J. The aging US population and residential energy demand. Energy Policy , v. 35, p. 743-745, 2006.) and Liddle (2004LIDDLE, B. Demographic dynamics and per capita environmental impact: using panel regressions and household decompositions to examine population and transport. Population and Environment, v. 26, n. 1, 2004.), who verified that population aging affects electricity consumption. However, it is necessary to consider, jointly, the analysis of the structureeffect [S (GDP/P)], an economic indicator of the region in relation to the population, estimating that in regions with a less developed economy, population aging may contribute with less magnitude in the variation of consumption. The results were different from those of Liddle (2011LIDDLE, B. Consumption-driven environmental impact and age structure change in OECD countries. Demographic Research, v.24, p. 749-770, 2011.), who found a negative relationship between consumption and the median age groups (35-49 and 50-69).
Model 3
In Model 3, the contribution of the activity effect [A (Tar)] and structureeffect [S (MW/Tar)] was positive in all regions, being the latter more relevant (Figures 7c, 8c, 9c, 10c and 11c). The activity effect was not significant in the variation of consumption, with a positive contribution varying between 9 and 19%, being the highest index in the North region. In this respect, the results differ from Villareal and Moreira (2019VILLAREAL, M. J. C.; MOREIRA, J. M. L. Household consumption of electricity in Brazil between 1985 and 2013. Energy Policy , v. 96, p. 251-259, 2019.), who observed a negative relationship between the tariff and consumption during the period of 1985-2013. This result leads to an interpretation that, despite the small variation in the value of the tariff between the years of 2000 and 2018, the cost of electricity showed to be relevant in household expenditure, especially in low-income households, requiring restriction in the electricity use to control the expenses at home, and therefore leading the tariff to a little contribution in the variation of consumption. Thus, it is estimated that the low-income conditions of households lead to restrict the consumption of electricity to meet all the needs that this service could be providing to the family, situation that is in line with the concept of energy poverty.
The structure effect [S (MW/Tar)] contributed with 225% and 135% of the variation in consumption on Southeast and South regions, consistent with the analysis of the appreciation of the minimum wage against the tariff, seem on Figure 1 and thus, boosting the consumption of electricity. In economically stable households, even though they have income linked to the minimum wage, it is estimated that this valuation allowed a higher degree of use of appliances, in addition to the increase in the appliances ownership. The quality of life and purchase power effect [Q (H/GDP)] presented a relevant and divergent contribution between the Midwest and Southeast regions, corresponding to 51% and -33%, respectively.
Discussion
The importance of energy studies that apply index decomposition analysis is the investigation of the contribution of each effect in the variation of energy consumption. In this study, the decomposition analysis contributed to reveal the main drives of the household electricity consumption growth in Brazil during the last 19 years, over a spectrum of variables.
Empirical analyses showed that the growth of household numbers contributed significantly to the variation in consumption between years 2000 and 2018 in all regions, mainly in urban areas and in the North and Southeast regions. However, it was observed that an acceleration of population aging in rural areas, led to a smaller number of people per household and an expectation of greater dependence on household income in terms of social benefits, such as retirement. This social process may explain the lower impact of rural households on the variation in electricity consumption. It is also believed that the analysis of the activity effect by household location (urban and rural) would be better estimated with the availability of electricity consumption data disaggregated by rural households, as well as the demographic characteristics of these households.
The analysis of the effect of households disaggregated by income range in the variation of consumption showed different situations between regions. In general, households with incomes up to 5 minimum wages (MW) have boosted consumption growth, incremented by those households that migrated from the income range above 5 MW to the lower income ranges. Despite the households with income range above 5 MW have presented the highest consumption rates, only in the Midwest and South regions those households presented a positive and significant contribution to the variation in consumption. Thus, the analyses direct the need to intensify energy efficiency criteria, especially devoted to buildings constructed aiming families with income up to 5 MW, and to household appliances that help in the domestic tasks, those with intense use and higher rates of ownership in Brazil.
The activity effect by population [A (P)] in the Model 2 showed a positive and less significant contribution to the variation of consumption than the activity effect of households [A (H)] in the Model 1. Demography analysis indicated that the reduction in the number of people per household led to a slowdown in consumption, especially in the North and Southeast regions. The age group P0-14 presented negligible contribution in the North region, and negative effect in the others. The age group of P35-59 showed a significant contribution to the growth of consumption in all regions, indicating the positive influence of the economically active population with the variation of consumption. In the North region there was also a relevant contribution from the P15-34 group, estimating that there is relevance of the economic activity of these people influencing consumption at home. Not surprisingly, the Southeast and South regions, which present the demographic transition process at a more advanced stage, had a positive and relevant contribution related to electricity consumption by the population of the P60+ group. It is estimated that in the future this will be the electricity consumption scenario in the other regions. Within the demographic context, based on the regional analyses, the construction of energy policies integrated into social policies is recommended, reinforcing the observations of Royston, Selby and Shove (2018ROYSTON S.; SELBY J.; SHOVE, E. Invisible energy policies: a new agenda for energy demand reduction. Energy Police, v. 123, p. 127-135, 2018.), that policies aimed at reducing electricity consumption should go beyond the limits of energy policies. Incentives to raise awareness of the population about the advantages of energy efficiency, especially economically active people, could slow down the consumption in medium and long term.
The analysis of the tariff, as an activity effect [A (Tar)] in the Model 3, showed that its value imposes a restriction on the electricity consumption, especially in low-income households, even though the tariff showed little price variation during the period. The restriction in the use of electricity with the aim to control expenses is related to energy poverty. In this sense, the results lead to estimated that the social tariff policy may not be fulfilling the objective of reducing energy poverty, mainly in the low-income households, but acting as a consumption limiter to maintain the conditions of the reduced tariff benefit. On the other hand, the appreciation of the minimum wage, much higher than the tariff, boosted the growth of electricity consumption in all regions, especially in the South and Southeast. From this perspective, the policies for income distribution and promotion of access to goods, implemented by Government between 2000 and 2018, according to Abrahão and Souza ([2021ABRAHÃO, K. C. F. J.; SOUZA, R. V. G. Estimativa da evolução do uso final de energia elétrica no setor residencial do Brasil por regiões geográficas. Ambiente Construído, Porto Alegre, 2021.]), affected positively the variation in consumption during the period. In hot climate regions, household income showed no control over consumption, except in low-income households. In addition, energy efficiency policies should pay special attention to equipment with greater end use in hot climate regions, identified by Abrahão and Souza ([2021]ABRAHÃO, K. C. F. J.; SOUZA, R. V. G. Estimativa da evolução do uso final de energia elétrica no setor residencial do Brasil por regiões geográficas. Ambiente Construído, Porto Alegre, 2021.), raising targets to promote a better energy efficiency index.
The variation of regional economic growth, interpreted in this study through the variation of GDP, proved to be less important than the variation of the minimum wage to boost the consumption of electricity in households. It was observed that the greatest influence of the minimum wage on consumption growth is due to the majority of households in Brazil having an income range up to 5 minimum wages. The identification of this link, within the national minimum wage policy context, can represents an opportunity for energy policies devoted to low-income families.
Conclusion
This study analyzed the variation in electricity consumption by the residential sector by region in Brazil, between the years 2000 and 2018, based on an IDA index and the application of the LMDI-I decomposition method in its additive form. A panel data set comprising 1406 observations was constructed, a new IDA equation with four effects proposed: activity, structure, quality of life and purchasing power, and intensity, as well as three different models. The activity effect in each model corresponded to household, population, and electricity tariff, respectively. The application of LMDI-I, which demand effort to gather disaggregated data into levels and sublevels, contributed to reveal the main drives of the household electricity consumption growth in Brazil during the last 19 years. Unprecedentedly, the study presents a relationship of electricity consumption with population age groups estimated from the PPH 2019 data survey (ELETROBRAS, 2019ELETROBRAS. Pesquisa de posse e hábitos de uso de equipamentos elétricos na Classe Residencial. Relatório Técnico 2019. 2019. Available at: Available at: https://eletrobras.com/pt/AreasdeAtuacao . Access in: 15 dec. 2019.
https://eletrobras.com/pt/AreasdeAtuacao...
), which were essential for a further refinement of decomposition analysis.
In general, the study gathered a literature review in the context of electricity consumption by residential sector in Brazil, and a brief methodological review on IDA index and the LMDI-I decomposition techniques. All the data, provided by official sources, were essential for the development of this study. It is also noteworthy that the introduction of the demography characteristics of households in the recent publication of the PPH 2019 were relevant for this study. However, data from the PPH 2019 are restricted to households located in dense urban areas, with a gap in official data related to households located in urban areas with less than 100,000 household units, and rural areas.
Electricity decomposition effects presented contributions of different forms, properties and magnitudes between the regions, reinforcing the observations of Tso and Guan (2014TSO, G. K. F.; GUAN, J. A multilevel regression approach to understand effects of environment indicators and household features on residential energy consumption. Energy ,v. 66, p. 722-731, 2014.) and Abrahão and Souza ([2021ABRAHÃO, K. C. F. J.; SOUZA, R. V. G. Estimativa da evolução do uso final de energia elétrica no setor residencial do Brasil por regiões geográficas. Ambiente Construído, Porto Alegre, 2021.]) that regional singularities of socioeconomic conditions and processes affect, in a different manner, the impulses of the growth in electricity consumption. The results reaffirmed the empirical evidence identified by other studies, that the increase of the household numbers is one of the greatest drivers of residential consumption growth. The results showed that urban households drive consumption growth much higher than rural households; and that the reduction in the number of people per household has led to a slowdown in consumption, especially in the North and Southeast regions. Despite a lower share of appliance at home, it is also believed that households with fewer people, and associated with less favorable income conditions, have greater control over electricity expenditures. The study identified that in hot climate regions, such as the North and Northeast, household income has no control over electricity consumption, except in those with income equal to and less than 2 minimum wages. Despite the tariff have showed little price variation during the period, its value imposes restriction on the electricity consumption of households, especially in those with low-income. As the behavior of reducing the use of electricity with the aim to control household expenditure is in line with the concept of energy poverty, effective measures to enlarge the use of electricity within the household, in addition to the social tariff, must be expanded. On the other hand, the appreciation of the minimum wage, much higher than the tariff, boosted the growth of electricity consumption in the higher income households, especially in the South and Southeast regions. The regional economic growth, interpreted in this study through the GDP variation, proved to be of less importance than the variation in the minimum wage to drives electricity consumption growth.
Unprecedentedly, the results showed that the residential electricity consumption in Brazil varies with population age, and in a positive way with the economically active phase of life, up to the age of 59, mainly in Southeast and South regions. However, there is a sharp reduction in consumption from age of 60 and above, with less magnitude on South region, which is expected to be related to the lower income conditions of the elderly in relation to the income of the active population, and consistent with the findings of Liddle and Lung (2010LIDDLE, B.; LUNG, S. Age-structure, urbanization, and climate change in developed countries: Revisiting STIRPAT for disaggregated population and consumption-related environmental impacts. Population Environmental , v. 31, p. 317-343, 2010.), Brounen, Kok and Quigley (2012BROUNEN, D.; KOK, N.;QUIGLEY, J. M. Residential energy use and conservation: economics and demographics. European Economic Review, 56, p.931-945, 2012. ), and Estiri and Zagheni (2019ESTIRI, H.; ZAGHENI, E. Age matters: aging and household energy demand in the United States. Energy Research and Social Science, v. 5, p. 62-70, 2019.).
According to Zaidi (2015ZAIDI, A. Aging and development. Professional development reading pack, N. 25. Applied Knowledge Services - GSDRC. November, 2015. Available at: Available at: http://www.gsdrc.org/wp-content/uploads/2015/11/Aging-and-Development_RP1.pdf . Access in: 15 mar. 2020.
http://www.gsdrc.org/wp-content/uploads/...
) and Royston, Selby and Shove (2018ROYSTON S.; SELBY J.; SHOVE, E. Invisible energy policies: a new agenda for energy demand reduction. Energy Police, v. 123, p. 127-135, 2018.), one of the biggest challenges of public policy is related to the cross cutting introduction of social aspects, evolving into interdisciplinary politics. It is estimated that social processes, especially the demographic transition and urbanization processes, are presenting opportunities to integrate energy in social policies. This integration will require more sophisticated energy efficiency policies, which should consider the growth of the elderly population for the coming years and the possibility of dilating their economic activity time, if the Social Security reform is approved. The integration between energy efficiency policy and social policy should be devoted to the elderly and to low income families, e.g., providing the exchange of existing appliances, with high rates of ownership, for more efficient ones, providing social benefits programs linked to minimum wage payment facilitating the purchase of appliances that perform domestic tasks (additionally, contributing to decrease energy poverty levels), providing better thermal comfort in buildings, mainly in those located in hot climate regions, such as the North and Northeast. Since the electricity access grid has high rates in Brazil, except in the North rainforest areas, the restriction in the use of electricity was identified in this study relating to tariff costs and household income. Revision on electricity tariff policy should focus on better social tariffs for low-income households.
The methodology and analyses of results of the study provide opportunities to be addressed in research and for energy policy formulations and detailing. The limits of the results refer to the data gap of electricity consumption by rural households, limiting the refinement of the estimation of the activity effect by rural household consumption. Additionally, other limits are related to the sample plan of the PPH 2019, once its average consumption data were used in this study.
It is recommended that studies like this should be elaborated more frequently, making it possible to evaluate the temporality of the application of the analyses, in addition to contemplating the processes experienced in the country in shorter time intervals. Furthermore, according to Abrahão and Souza ([2021ABRAHÃO, K. C. F. J.; SOUZA, R. V. G. Estimativa da evolução do uso final de energia elétrica no setor residencial do Brasil por regiões geográficas. Ambiente Construído, Porto Alegre, 2021.]), the analysis of residential electricity consumption should always consider the regional diversity of the country. Three aspects are highlighted to be incorporated in future studies, in order to evaluate its effects on electricity consumption:
-
the demography characteristics of Brazilian rural households by geographic regions;
-
the impact of the proposition of the Brazilian Social Security reform, initiated in 2019, considering its implication in the extension of economic and productive activity of some age groups of the population; and
-
the period of reclusion and social distancing rules in face of the COVID-19 pandemic, occurring currently in 2020 in Brazil, whichis affecting the energy consumption of all sectors in the country.
Acknowledgment
This study was partially funded by the Coordenação de Aperfeiçoamento de Pessoal de Nível Superior - Brasil (CAPES) - FinanceCode 001.
References
- ABRAHÃO, K. C. F. J.; SOUZA, R. V. G. Estimativa da evolução do uso final de energia elétrica no setor residencial do Brasil por regiões geográficas. Ambiente Construído, Porto Alegre, 2021.
- ACHÃO, C. C. L.; SCHAEFFER, R. Decomposition analysis of the variations in residential electricity consumption in Brazil for the 1980-2007 period: Measuring the activity, intensity and structure effects. Energy Policy, v. 37, p. 5208-5220, 2009.
- AGÊNCIA NACIONAL DE ENERGIA ELÉTRICA. Informações técnicas: consumidores ano 2018. Available at: https://www2.aneel.gov.br/area.cfm?idArea=550 Access in: 15 apr. 2020a.
» https://www2.aneel.gov.br/area.cfm?idArea=550 - AGÊNCIA NACIONAL DE ENERGIA ELÉTRICA. Tarifa média (R$/MWh) por classes de consumo e por regiões geográficas do Brasil 2003-2020. Available at: http://relatorios.aneel.gov.br/_layouts/xlviewer.aspx?id=/RelatoriosSAS/RelSampRegCC.xlsx&Source=http://relatorios.aneel.gov.br/RelatoriosSAS/Forms/AllItems.aspx&DefaultItemOpen=1 Access in: 15 apr. 2020b.
» http://relatorios.aneel.gov.br/_layouts/xlviewer.aspx?id=/RelatoriosSAS/RelSampRegCC.xlsx&Source=http://relatorios.aneel.gov.br/RelatoriosSAS/Forms/AllItems.aspx&DefaultItemOpen=1 - ALMEIDA, M. A.; SCHAEFFER, R.; LA ROVERE, E. L. The potential for electricity conservation and peak load reduction in the residential sector of Brazil. Energy, v. 26, n. 4, p. 413-429, 2001.
- ANDRADE, F. V.; PINHEIRO, R. B. Análise de decomposição da projeção de consumo residencial de energia elétrica no Brasil para o setor residencial. Engevista, v. 16, n. 4, p. 340-355, 2014.
- ANG, B.W. A simple guide to LMDI decomposition analysis. Singapore: National University of Singapore, 2012.
- ANG, B. W. Decomposition analysis for policymaking in energy: which is the preferred method? Energy Policy , v. 32, p.1131-1139, 2004.
- ANG, B.W. LMDI decomposition approach: a guide for implementation. Energy Policy , v. 86, p. 233-238, 2015.
- ANG, B. W. The LMDI approach to decomposition analysis: a practical guide. Energy Policy , v. 33, p. 867-871, 2005.
- ANG, B.W.; WANG, H. Index decomposition analysis with multidimensional and multilevel energy data. Energy Economics, v. 51, p. 67-76, 2015.
- ANG, B.W.; ZHANG, F. Q. A survey of index decomposition analysis in energy and environmental studies. Energy , v. 25, n. 12, p. 1149-1176, 2000.
- ANG, B. W.; ZHANG, F.O.; CHOI, K. H. Factorizing changes in energy and environmental indicator through decomposition. Energy , v. 33, p. 489-495, 1998.
- ASSOCIAÇÃO DE EMPRESAS DE PESQUISA. Critério de classificação econômica Brasil - 2018. Available at: https://www.abep.og/criterio-Brazil Access: 08 apr. 2020.
» https://www.abep.og/criterio-Brazil - BARDAZZI, R.; PAZIENZA, M.G. When I was your age: generational effects on long-run residential energy consumption in Italy. Energy Research &Social Science, v. 70, 2020.
- BOERI, A. et al Future design approaches for energy poverty: users profiling and services for no-vulnerable condition. Energies, v.13, n. 8, 2020.
- BRAZIL. Câmara dos Deputados. Consultoria Legislativa, Brasília, DF, 2005. Francisco José Rocha de Sousa. A evolução das tarifas de energia elétrica e do salário mínimo. Available at: Available at: http://www2.camara.leg.br/a-camara/documentos-e-pesquisa/estudos-e-notas-tecnicas/areas-da-conle/tema16/2005_14301.pdf Access in: 15 Jul. 2017.
» http://www2.camara.leg.br/a-camara/documentos-e-pesquisa/estudos-e-notas-tecnicas/areas-da-conle/tema16/2005_14301.pdf - BRAZIL. Lei no 10.741 de 1o de outubro de 2003 - Dispõe sobre o Estatuto do Idoso e dá outras providências. Diário Oficial da União, Brasília, DF, 3 out. 2003. Available at: Available at: http://www.planalto.gov.br/ccivil_03/leis/2003/L10.741.htm Access in: 15 Jan. 2018.
» http://www.planalto.gov.br/ccivil_03/leis/2003/L10.741.htm - BRAZIL. Lei nº 11.852, de 05 de agosto de 2013. Institui o Estatuto da Juventude e dispõe sobre os direitos dos jovens, os princípios e diretrizes das políticas públicas de juventude e o Sistema Nacional de Juventude. Diário Oficial da União , Brasília, DF, 6 ago. 2013. Available at: Available at: http://www.planalto.gov.br/ccivil_03/_ato2011-2014/2013/lei/l12852.htm Access in: 15 Jan. 2020.
» http://www.planalto.gov.br/ccivil_03/_ato2011-2014/2013/lei/l12852.htm - BRAZIL. Lei nº 9.032, de 28 de abril de 1995. Dispõe sobre o valor do salário mínimo, altera dispositivos das Leis nº 8.212 e nº 8.213, ambas de 24 de julho de 1991, e dá outras providências. Diário Oficial da União , Brasília, DF, 28 abr. 1995. Available at: Available at: http://www.planalto.gov.br/ccivil_03/Leis/L9032.htm Access in: 15 Jun. 2018.
» http://www.planalto.gov.br/ccivil_03/Leis/L9032.htm - BRAZIL. Lei nº 12.513, de 26 de outubro de 2011.Institui o Programa Nacional de Acesso ao Ensino Técnico e Emprego (Pronatec); altera as Leis nº 7.998, de 11 de janeiro de 1990, que regula o Programa do Seguro-Desemprego, o Abono Salarial e institui o Fundo de Amparo ao Trabalhador (FAT), nº 8.212, de 24 de julho de 1991, que dispõe sobre a organização da Seguridade Social e institui Plano de Custeio, nº 10.260, de 12 de julho de 2001, que dispõe sobre o Fundo de Financiamento ao Estudante do Ensino Superior, e nº 11.129, de 30 de junho de 2005, que institui o Programa Nacional de Inclusão de Jovens (ProJovem); e dá outras providências. Diário Oficial da União , Brasília, DF, 27 out. 2011. Available at: Available at: http://www.planalto.gov.br/ccivil_03/_ato2011-2014/2011/lei/l12513.htm Access in: 15 Jan. 2020.
» http://www.planalto.gov.br/ccivil_03/_ato2011-2014/2011/lei/l12513.htm - BRAZIL. Lei nº 11.692, de 10dejunho de 2008.Dispõe sobre o Programa Nacional de Inclusão de Jovens - Projovem, instituído pela Lei no11.129, de 30 de junho de 2005; altera a Lei no10.836, de 9 de janeiro de 2004; revoga dispositivos das Leis nos9.608, de 18 de fevereiro de 1998, 10.748, de 22 de outubro de 2003, 10.940, de 27 de agosto de 2004, 11.129, de 30 de junho de 2005, e 11.180, de 23 de setembro de 2005; e dá outras providências. Diário Oficial da União , Brasília, DF, 11 jun. 2008. Available at: Available at: http://www.planalto.gov.br/ccivil_03/_ato2007-2010/2008/lei/l11692.htm Access in: 15 Jan. 2020.
» http://www.planalto.gov.br/ccivil_03/_ato2007-2010/2008/lei/l11692.htm - BROUNEN, D.; KOK, N.;QUIGLEY, J. M. Residential energy use and conservation: economics and demographics. European Economic Review, 56, p.931-945, 2012.
- CARRARA, A. F.; CORREA, A. L. O regime de metas de inflação no Brasil: uma análise empírica do IPCA. Revista Economia Contemporânea, Rio de Janeiro, v.16, n.3, p. 441-462, set./dez. 2012.
- DEUTSCH, M.; TIMPE, P. The effect of age on residential energy demand. In: EUROPEAN COUNCIL FOR AN ENERGY EFFICIENT ECONOMY SUMMER STUDY, Hyères, 2013. Proceedings … Hyères: ECEEE Summer Study, 2013.
- ELETROBRAS. Pesquisa de posse e hábitos de uso de equipamentos elétricos na Classe Residencial. Relatório Técnico 2019. 2019. Available at: Available at: https://eletrobras.com/pt/AreasdeAtuacao Access in: 15 dec. 2019.
» https://eletrobras.com/pt/AreasdeAtuacao - EMPRESA DE PESQUISA ENERGÉTICA. Balanço Energético Nacional 2020: ano base 2019. Available at: http://www.epe.gov.br/pt/publicacoes-dados-abertos/publicacoes/balanco-energetico-nacional-2020 Access in: 29 dec. 2020.
» http://www.epe.gov.br/pt/publicacoes-dados-abertos/publicacoes/balanco-energetico-nacional-2020 - EMPRESA DE PESQUISA ENERGÉTICA. Balanço Energético Nacional 2019: ano base 2018. Available at: http://www.epe.gov.br/pt/publicacoes-dados-abertos/publicacoes/balanco-energetico-nacional-2019 Access in: 15 dec. 2019a.
» http://www.epe.gov.br/pt/publicacoes-dados-abertos/publicacoes/balanco-energetico-nacional-2019 - EMPRESA DE PESQUISA ENERGÉTICA. Mercado Mensal para download: consumo mensal de energia elétrica por classe, Brasil e regiões. Available at: http://www.epe.gov.br/pt/publicacoes-dados-abertos/publicacoes/consumo-de-energia-eletrica Access in: 15 dec. 2019b.
» http://www.epe.gov.br/pt/publicacoes-dados-abertos/publicacoes/consumo-de-energia-eletrica - ENERDATA. Global Energy Statistical Yearbook 2019 - Electricity. Available at: https://yearbook.enerdata.net/electricity/electricity-domestic-consumption-data.html Access in: 15 apr. 2020.
» https://yearbook.enerdata.net/electricity/electricity-domestic-consumption-data.html - ESTIRI, H.; ZAGHENI, E. Age matters: aging and household energy demand in the United States. Energy Research and Social Science, v. 5, p. 62-70, 2019.
- GHISI, E.; GOSCH, S.; LAMBERTS, R. Electricity end-uses in the residential sector of Brazil. Energy Policy , v. 35, n. 8, p. 789-202, 2007.
- HAMZA, N.;GILROY, R. The challenge to UK energy policy: an aging population perspective on energy saving measures and consumption. Energy Policy , v. 39, p.782-789, 2011.
- INSTITUTO BRASILEIRO DE GEOGRAFIA E ESTATÍSTICA. Sistema de contas nacionais trimestrais: downloads: Produto Interno Bruto (valores correntes) - Brasil, grandes regiões. Available at: https://www.ibge.gov.br/estatisticas/economicas/contas-nacionais/9054-contas-regionais-do-brasil.html?=&t=downloads Access in: 15 oct. 2020a.
» https://www.ibge.gov.br/estatisticas/economicas/contas-nacionais/9054-contas-regionais-do-brasil.html?=&t=downloads - INSTITUTO BRASILEIRO DE GEOGRAFIA E ESTATÍSTICA. Projeções da População por sexo e idade - Brasil: 2000-2060 e Unidades da Federação - 2000-2030. Available at: https://www.ibge.gov.br/estatisticas/sociais/populacao/9109-projecao-da-populacao.html?edicao=9116&t=resultados Access in:15 jan. 2020b.
» https://www.ibge.gov.br/estatisticas/sociais/populacao/9109-projecao-da-populacao.html?edicao=9116&t=resultados - INSTITUTO BRASILEIRO DE GEOGRAFIA E ESTATÍSTICA. Pesquisa Nacional por Amostra de Domicílios - PNAD - 1999: grandes regiões. Available at: https://www.ibge.gov.br/estatisticas/sociais/habitacao/9127-pesquisa-nacional-por-amostra-de-domicilios.html?=&t=downloads Access in: 15 jan. 2020c.
» https://www.ibge.gov.br/estatisticas/sociais/habitacao/9127-pesquisa-nacional-por-amostra-de-domicilios.html?=&t=downloads - INSTITUTO BRASILEIRO DE GEOGRAFIA E ESTATÍSTICA. Pesquisa Nacional por Amostra de Domicílios - PNAD - 2001: grandes regiões. Available at: https://www.ibge.gov.br/estatisticas/sociais/habitacao/9127-pesquisa-nacional-por-amostra-de-domicilios.html?=&t=downloads Access in: 15 jan. 2020d.
» https://www.ibge.gov.br/estatisticas/sociais/habitacao/9127-pesquisa-nacional-por-amostra-de-domicilios.html?=&t=downloads - INSTITUTO BRASILEIRO DE GEOGRAFIA E ESTATÍSTICA. Pesquisa Nacional por Amostra de Domicílios - PNAD: downloads - grandes regiões. Available at: https://www.ibge.gov.br/estatisticas/sociais/trabalho/17270-pnad-continua.html?=&t=downloads. Access in: 15 jan. 2020e.
» https://www.ibge.gov.br/estatisticas/sociais/trabalho/17270-pnad-continua.html?=&t=download - INSTITUTO BRASILEIRO DE GEOGRAFIA E ESTATÍSTICA. Pesquisa Nacional de Amostra de Domicílios: trabalho infantil 2001. Rio de Janeiro, 2003.
- INSTITUTO BRASILEIRO DE GEOGRAFIA E ESTATÍSTICA. Pesquisa Nacional de Amostra de Domicílios - Síntese de Indicadores 2015. Rio de Janeiro, 2016.
- INSTITUTO BRASILEIRO DE GEOGRAFIA E ESTATÍSTICA. Sidra - Banco de tabelas estatísticas. População. Tabela 1378: população residente, por situação do domicílio, sexo e díade, segundo a condição no domicílio e comportamento da responsabilidade pelo domicílio. Available at: https://sidra.ibge.gov.br/pesquisa/censo-demografico/demografico-2010/universo-caracteristicas-da-populacao-e-dos-domicilios Access in: 15 Jan. 2020f.
» https://sidra.ibge.gov.br/pesquisa/censo-demografico/demografico-2010/universo-caracteristicas-da-populacao-e-dos-domicilios - INSTITUTO BRASILEIRO DE GEOGRAFIA E ESTATÍSTICA. Síntese de Indicadores Sociais: uma análise das condições de vida da população Brasileira 2013. Rio de Janeiro, 2014.
- INSTITUTO BRASILEIRO DE GEOGRAFIA E ESTATÍSTICA. Sidra - Banco de tabelas estatísticas. Economia. Índice Nacional de Preços ao Consumidor Amplo - IPCA. Tabela 1737: IPCA - Série histórica com número-índice, variação mensal e variações acumuladas em 3 meses, em 6 meses, no ano e em 12meses (a partir de dezembro/1979). Available at: https://sidra.ibge.gov.br/pesquisa/snipc/ipca/tabelas/brasil/dezembro-2020 Access in: 15 oct. 2019.
» https://sidra.ibge.gov.br/pesquisa/snipc/ipca/tabelas/brasil/dezembro-2020 - INTERNATIONAL ENERGY AGENCY. Energy efficiency indicators: methodology booklet. 2010. Available at: Available at: http://www.osti.gov/scitech/servlets/purl/985845 Access in: 15 may 2019.
» http://www.osti.gov/scitech/servlets/purl/985845 - IPEADATA. Salário mínimo mensal vigente: 1940-2019. Available at: http://www.ipeadata.gov.br/ExibeSerie.aspx?stub=1&serid1739471028=1739471028 Access in: 15 jan. 2020.
» http://www.ipeadata.gov.br/ExibeSerie.aspx?stub=1&serid1739471028=1739471028 - JANUZZI, G. M.; SCHIPPER, L. The structure of electricity demand in the Brazilian household sector. Energy Policy , v. 19, n. 11, p. 879-891, 1991.
- JORGENSON, A.; RICE, J.; CLARK, B. Cities, slums, and energy consumption in less developed countries, 1990 to 2005. Organization and Environment, v. 23, n. 2, p. 189-204, 2010.
- LEON, N.; PESSANHA, J. F. M. Dinâmica da evolução do consumo de energia no setor residencial. In: SEMINÁRIO NACIONAL DE PRODUÇÃO E TRANSMISSÃO DE ENERGIA ELÉTRICA, 18., Curitiba, 2005. Proceedings … Curitiba, 2005.
- LESTHAEGHE, R. The second demographic transition: a concise overview of its development. Proceedings of the National Academy of Sciences of the United States of America, v. 111, n. 51, 18112-18115, 2014.
- LIDDLE, B. Consumption-driven environmental impact and age structure change in OECD countries. Demographic Research, v.24, p. 749-770, 2011.
- LIDDLE, B. Demographic dynamics and per capita environmental impact: using panel regressions and household decompositions to examine population and transport. Population and Environment, v. 26, n. 1, 2004.
- LIDDLE, B. Impact of population, age structure, and urbanization on carbon emission/energy consumption: evidence from macro-level, cross-country analyses. Population Environmental, v. 35, n. 3, p. 286-304, 2014.
- LIDDLE, B. Population, affluence, and environmental impact across development: evidence from panel cointegration modeling. Environmental Modelling & Software, v. 40, p. 255-266, 2013.
- LIDDLE, B.; LUNG, S. Age-structure, urbanization, and climate change in developed countries: Revisiting STIRPAT for disaggregated population and consumption-related environmental impacts. Population Environmental , v. 31, p. 317-343, 2010.
- LINS, F. E. Demanda por energia elétrica residencial urbana no Brasil: uma análise baseada nos microdados das POFs 2002-2003 e 2008-2009. Recife, 2010. Tese (Doutorado em Economia) - Universidade Federal de Pernambuco, Recife, 2010.
- MAIA, A. G.; BUAINAIM, A. M. O novo mapa da população rural Brasileira. Confins, v. 25, 2015.
- MINITAB. Minitab 17 Statistical Software. State College: Minitab, 2010.
- MORISHITA, C.; GHISI, E. Assessment of the impact of energy-efficiency household appliances on the electricity consumption in the residential sector of Brazil. In: WORLD ENERGY COUNCIL CONGRESS, Montreal, 2010. Proceedings … Montreal: World Energy Council Congress, 2010.
- O’NEIL, B. C.; CHEN, B. S. Demographic determinants of household energy use in the United States. Population and Development Review, v. 28, p. 53-88, 2002.
- PEREIRA JUNIOR, A. O. et al Strategies to promote renewable energy in Brazil. Renewable and Sustainable Energy Reviews, v. 15, p. 681-688, 2011.
- PESSANHA, J. F. M.; LEON, N. Forecasting long-term electricity demand in the residential sector. Population Environmental , v. 55, p. 529-538, 2015.
- PESSANHA, J.F.M.; LEON, N. Long-term forecasting of household and residential electric customers in Brazil. IEEE Latin America Transaction, v.10, n. 2, p.1537-1543, 2012.
- ROYSTON S.; SELBY J.; SHOVE, E. Invisible energy policies: a new agenda for energy demand reduction. Energy Police, v. 123, p. 127-135, 2018.
- SILVA, A. S. et al Knowing electricity end-uses to successfully promote energy efficiency in buildings: a case study in low-income houses in Southern Brazil. International Journal of Sustainable Energy Planning and Management, v. 2, p. 7-18, 2014.
- SZÉP, T. S. Eight methods for decomposing the aggregate energy intensity of the economic structure. Club of Economics in Miskolc TOM, v. 9, n. 1, p.77-84, 2013.
- TONN, B.; EISENBERG, J. The aging US population and residential energy demand. Energy Policy , v. 35, p. 743-745, 2006.
- TSO, G. K. F.; GUAN, J. A multilevel regression approach to understand effects of environment indicators and household features on residential energy consumption. Energy ,v. 66, p. 722-731, 2014.
- TURRA, C. M.; QUEIROZ, B. L. Before it’s too late: demographic transition, labour supply, and social security problems in Brazil. United Nations Expert Group Meeting on Social and Economic Implications of Changing Population Age Structures. 2007. Available at: Available at: https://www.un.org/en/development/desa/population/publications/pdf/aging/egm-mex-turra.pdf Access in: 15 dec. 2018.
» https://www.un.org/en/development/desa/population/publications/pdf/aging/egm-mex-turra.pdf - UHR, D. A. P.; CHAGAS, A. L. S.; UHR, J. Z. G. Estimations of elasticities for electricity demand in Brazilian households and policy implications. Energy Police, v. 129, p. 69-79, 2019.
- UNITED NATIONS. Department of Economic and Social Affairs, Population Division. World Population Prospects: The 2017 Revision, Key Findings and Advance Tables. 2017. Working Paper No. ESA/P/WP/248.
- VERAS, R. Population aging today: demands, challenges and innovations. Revista Saúde Pública, v. 43, n. 3, 2009.
- VILLAREAL, M. J. C.; MOREIRA, J. M. L. Household consumption of electricity in Brazil between 1985 and 2013. Energy Policy , v. 96, p. 251-259, 2019.
- WOLFRAM, C.; SHELEF, O.; GERTLER, P. How will energy demand develop in the developing world? Journal of Economic Perspectives, v. 26, n.1, p. 119-138, 2012.
- WORLD HEALTH ORGANIZATION. Coronavirus disease 2019 (COVID-19). Situation Report 51. Available at: https://www.who.int/docs/default-source/coronaviruse/situation-reports/20200311-sitrep-51-covid-19.pdf?sfvrsn=1ba62e57_10 Access in: 26 apr. 2020.
» https://www.who.int/docs/default-source/coronaviruse/situation-reports/20200311-sitrep-51-covid-19.pdf?sfvrsn=1ba62e57_10 - XIAOYAN, X. Index decomposition analysis of energy consumption and carbon emissions: some methodological issues. Singapore, 2013. Doctoral Thesis - Department of Industrial and Systems Engineering, National University of Singapore, Singapore, 2013.
- XU, X.Y.; ANG, B.W. Analyzing residential energy consumption using index decomposition analysis. Applied Energy , v. 113, p. 342-351, 2014.
- ZAIDI, A. Aging and development. Professional development reading pack, N. 25. Applied Knowledge Services - GSDRC. November, 2015. Available at: Available at: http://www.gsdrc.org/wp-content/uploads/2015/11/Aging-and-Development_RP1.pdf Access in: 15 mar. 2020.
» http://www.gsdrc.org/wp-content/uploads/2015/11/Aging-and-Development_RP1.pdf - ZANON, R. R.; MORETTO, A. C.; RODRIGUES, R. L. Aging of population and changes in consumption patterns: impacts on the production structure in Brazil. Revista Brasileira de Estudos de População, v. 30, p. S45-S67, 2014.
Publication Dates
-
Publication in this collection
05 Mar 2021 -
Date of issue
Apr-Jun 2021
History
-
Received
09 July 2020 -
Accepted
03 Sept 2020


 Source: prepared by the authors from IEA (
 Source: prepared by the authors from
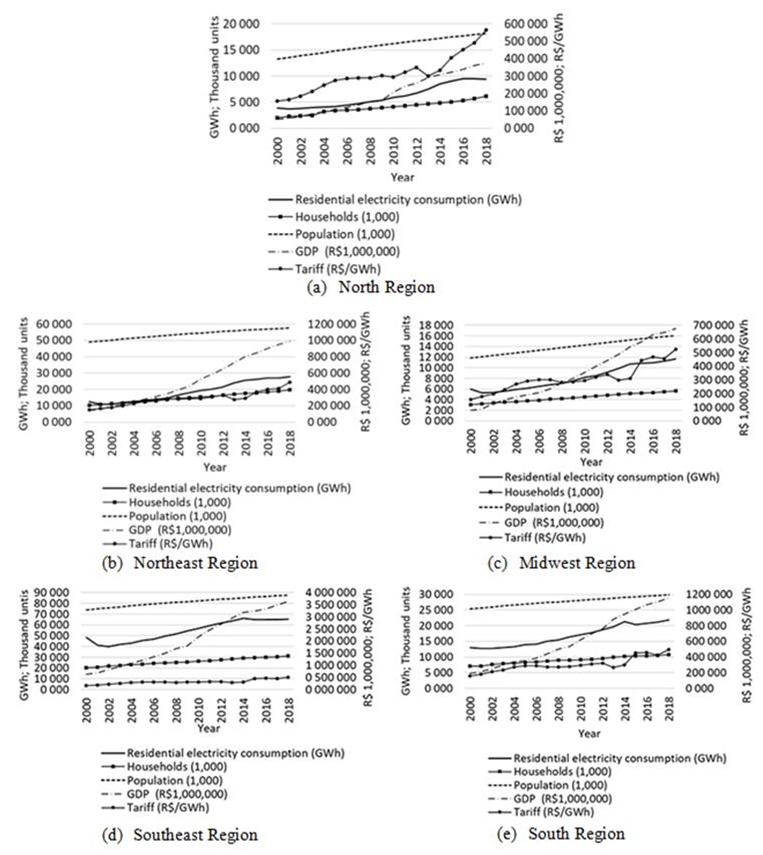
 Source: prepared by the authors from IBGE (
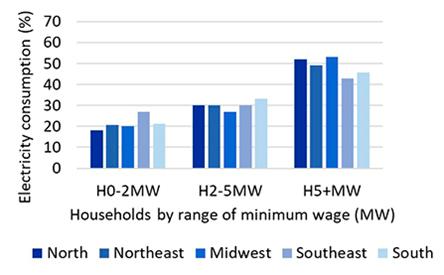 Source: prepared by the authors from
  Source: prepared by the authors from IBGE (
 Source: prepared by the authors from