Abstract
The performance of plumbing systems is directly related to water and energy consumption. Malfunction of components in these systems can cause water waste and discomfort to users. In this research, the performance of 607 plumbing fixtures was investigated in five public buildings focused on sports activities in the city of Joinville, Southern Brazil. The flow rates and leaks in all installed plumbing fixtures were verified. The measured flow rate values were compared to those established by Brazilian standards and by environmental certifications LEED and AQUA. Flow rates of showers with water at 40°±2 °C were measured in summer and winter to compare the performance of showers in different seasons. The flow rates in showers displayed worse performance in winter than in summer. Also, 30.9% of taps showed some type of leak and 77.8% of toilets trickled. Of all plumbing fixtures, 71.7% presented some kind of defect. The results presented in this study indicate the main problems related to the performance of plumbing fixtures installed in public sports facilities in Joinville and can be useful in planning building preventive maintenance and water conservation actions.
Keywords:
Flow rate; Performance; Plumbing fixture; Public building; Sports facilities
Resumo
O desempenho dos sistemas prediais está diretamente relacionado ao consumo de água e de energia. O mau funcionamento dos componentes nesses sistemas pode causar desperdício de água e desconforto aos usuários. Nesta pesquisa, o desempenho de 607 equipamentos hidrossanitários em cinco edifícios públicos de esportes na cidade de Joinville-SC foi avaliado. Verificaram-se as vazões e os vazamentos em todos os equipamentos hidrossanitários. Os valores medidos foram comparados aos estabelecidos pelas normas brasileiras e certificações LEED e AQUA. Os chuveiros foram medidos com vazão à temperatura de 40°±2 °C durante o verão e o inverno para comparar seu desempenho em diferentes estações do ano. Os chuveiros apresentaram desempenho pior no inverno do que no verão. Além disso, 30,9% das torneiras estavam com algum tipo de vazamento e 77,8% das bacias sanitárias apresentaram vazamentos em filetes. 71,7% dos equipamentos estavam com algum tipo de defeito. Os resultados apresentados neste estudo apontam os principais problemas relacionados ao desempenho de equipamentos hidrossanitários instalados em edifícios públicos esportivos da cidade de Joinville, podendo ser utilizados para determinação de ações de manutenção preventiva e de conservação da água.
Palavras-chave:
Vazão; Desempenho; Equipamento hidrossanitário; Edifício publico; Edifício esportivo
Introduction
Public buildings correspond to a large portion of urban water consumption, therefore, they potentially can achieve considerable savings in drinking water (BERTONE et al., 2018aBERTONE, E. et al. Role of financial mechanisms for accelerating the rate of water and energy efficiency retrofits in Australian public buildings: Hybrid Bayesian Network and System Dynamics modelling approach. Applied Energy, v. 210, p. 409-419, 2018a.). In addition to the large number of leaks in public buildings compared to other sectors (KALBUSCH et al., 2018KALBUSCH, A. et al. Avaliação das condições de operação de equipamentos hidrossanitários em edificações públicas (Evaluation of operating conditions of plumbing fixtures in public buildings). Ambiente Construído, Porto Alegre, v. 18, n 1, p. 393-408, jan./mar. 2018. ), users of public buildings are not directly responsible for paying water bills. As a consequence, they are usually less concerned about avoiding wasted water (NUNES et al., 2018NUNES, L. G. C. F. et al. Rational water use indicators for public schools in Recife, Brazil. Water Science and Technology: Water Supply, v. 19, p. 207-215, 2018. ). However, there are some barriers in this sector hampering the implementation of strategies for improved water efficiency, such as public budget constraints, excessive and characteristic bureaucracy of the public sector, and the absence of mandatory levels of water efficiency for this type of building (BERTONE et al., 2016BERTONE, E. et al. State-of-the-art review revealing a roadmap for public building water and energy efficiency retrofit projects. International Journal of Sustainable Built Environment, v. 5, p. 526-548, 2016.).
It is necessary to monitor water consumption in buildings before adopting strategies for saving water, which may be done by in-situ data collection (BERTONE et al., 2016BERTONE, E. et al. State-of-the-art review revealing a roadmap for public building water and energy efficiency retrofit projects. International Journal of Sustainable Built Environment, v. 5, p. 526-548, 2016.). This phase is vital for identifying which plumbing fixtures consume more water, and it is necessary to prioritize such devices in water-savings strategies. In-situ data collection makes it possible to identify defects in plumbing fixtures that can impact users’ comfort and safety and/or plumbing fixtures that may cause waste of drinking water. The excessive bureaucracy of the public sector makes it difficult to perform a periodic maintenance on plumbing fixtures, and this implies in great amounts of wasted water (KALBUSCH et al., 2018KALBUSCH, A. et al. Avaliação das condições de operação de equipamentos hidrossanitários em edificações públicas (Evaluation of operating conditions of plumbing fixtures in public buildings). Ambiente Construído, Porto Alegre, v. 18, n 1, p. 393-408, jan./mar. 2018. ).
In a study performed in public schools in Recife, Northeast Brazil, the results showed that the leakage index (number of leaking plumbing fixtures compared to the total number of plumbing fixtures in the system) reached up to 27.8%. None of these schools had implemented preventive maintenance programs on their plumbing systems (NUNES et al., 2018NUNES, L. G. C. F. et al. Rational water use indicators for public schools in Recife, Brazil. Water Science and Technology: Water Supply, v. 19, p. 207-215, 2018. ). Water consumption brings yet another implication: the electricity consumption associated with it. Energy is required for treating and distributing water. Moreover, some water end uses also consume electricity, such as water heating (PLAPPALLY; LIENHARD V, 2012PLAPPALLY, A. K.; LIENHARD V, J. H. Energy requirements for water production, treatment, end use, reclamation, and disposal. Renewable and Sustainable Energy Reviews, v. 16, p. 4818-4848, 2012. ). According to Pimentel et al. (2009PIMENTEL, D. et al. Energy efficiency and conservation for individual Americans. Environment, Development and Sustainability, v. 11, p. 523-546, 2009. ), hot water heaters are the most energy consuming equipment in US houses, so combining water and energy savings could generate interesting results as a whole. Besides the water heating technology, energy consumption for heating water depends on personal preferences, such as the required water temperature and the duration of use (PLAPPALLY; LIENHARD V, 2012PLAPPALLY, A. K.; LIENHARD V, J. H. Energy requirements for water production, treatment, end use, reclamation, and disposal. Renewable and Sustainable Energy Reviews, v. 16, p. 4818-4848, 2012. ; CHENG et al., 2016CHENG, C. L. et al. Relationship between building hot water usage and energy and carbon reduction. Building Services Engineering Research and Technology, v. 37, p. 682-693, 2016. ). There is high water demand in sports facilities, and this increases the electricity consumption in those buildings (ZUCCARI; SANTIANGELI; ORECCHINI, 2017ZUCCARI, F.; SANTIANGELI, A.; ORECCHINI, F. Energy analysis of swimming pools for sports activities: cost effective solutions for efficiency improvement. Energy Procedia, v. 126, p. 123-130, 2017).
Electric showerheads end up being the most commonly used heating system for showering in Brazil (NOGUEIRA et al., 2015NOGUEIRA, L. A. H. et al. Evaluation of the energy impacts of the Energy Efficiency Law in Brazil. Energy for Sustainable Development, v. 24, p. 58-69, 2015. ). Despite the increase of energy consumption while showering, which generally coincides with electricity consumption peak times (especially in winter), sometimes electric showers can be considered more advantageous than gas and solar-water-heating systems. This is due to their lower annual primary energy consumption, lower annual water consumption, and because they avoid thermal losses from storage and hot water distribution (SANGOI; GHISI, 2019SANGOI, J. M.; GHISI, E. Energy Efficiency of Water Heating Systems in Single-Family Dwellings in Brazil. Water, v. 11, p. 1-18, 2019. ).
However, it is also necessary to address user comfort while showering, as well as environmental impacts. The city of Joinville (˗26.3°S, ˗48.8°W) in Southern Brazil, where this research took place, is characterized by intensely hot summers and cold winters. Therefore, it is necessary to provide comfortable water temperatures for hot and cold days.
Water consumption is usually lower in electric showers (PACHECO; LAMBERTS, 2013PACHECO, M.; LAMBERTS, R. Assessment of technical and economical viability for large-scale conversion of single family residential buildings into zero energy buildings in Brazil: climatic and cultural considerations. Energy Policy, v. 63, p. 716-725, 2013.; SANGOI; GHISI, 2019SANGOI, J. M.; GHISI, E. Energy Efficiency of Water Heating Systems in Single-Family Dwellings in Brazil. Water, v. 11, p. 1-18, 2019. ). However, to achieve higher temperatures in these plumbing fixtures, it is necessary to reduce the flow rate, and, on the contrary, the temperature will gradually reduce if the flow rate increases. Thus, electric showers tend to be less comfortable when there are higher flow rates and/or when the user wishes for increased temperatures. However, there are powerful electric showerheads capable of providing flow rates similar to those operating on gas heating systems, but with higher impacts on the environment, costs, and energy consumption (PACHECO; LAMBERTS, 2013PACHECO, M.; LAMBERTS, R. Assessment of technical and economical viability for large-scale conversion of single family residential buildings into zero energy buildings in Brazil: climatic and cultural considerations. Energy Policy, v. 63, p. 716-725, 2013.).
This paper aims to evaluate the performance of all plumbing fixtures (showers, taps, toilets, urinals, and drinking fountains) installed in five public buildings focused on sports activities in the city of Joinville, Southern Brazil. The analysis focused on the performance of plumbing fixtures, evaluating their flow rate and checking for eventual leaks and other defects. The flow rates were measured and compared to requirements defined by Brazilian standards and national and international certifications. To evaluate the performance of water heating systems, shower flow rates, and water temperatures were measured both on summer and winter days. Finally, questionnaires were filled out by gyms users so that they could express their views related to the performance of showers and showering comfort.
Methods
The proposed method consisted in analyzing the performance of all plumbing fixtures installed in five public buildings used for practicing sports in Joinville, Southern Brazil. The analysis was performed during the summer and winter seasons to assess the performance of water heating systems, and afterwards, questionnaires were filled out by a sampling of building users.
Four Gyms and one Stadium were visited during summer in Brazil. The Gyms are commonly used for sports such as indoor soccer, volleyball, basketball, and gymnastics. The Stadium, however, is used mostly for soccer. The analysis of the performance of the installed plumbing fixtures in these buildings was conducted in summer, including characteristics, such as flow rate, operating temperature, leakage, and any other identified defects. In winter, only measurements of the flow rate and temperatures of showers were repeated in the same buildings, observing any changes that may have occurred in their efficiency.
The study was carried out through in-situ data collection of all plumbing fixtures installed in the sports facilities (showers, taps, toilets, urinals, and drinking fountains). The presence of leaks and other defects were verified by visual inspection. Taps were classified according to their use (lavatory, kitchen, or cleaning taps). The spray type (linear or open) and the presence/absence of aerators were analyzed on these plumbing fixtures. On self-closing taps, the duration of the flow was verified to check if the values adhered to the NBR 13713 (ABNT, 2009ASSOCIAÇÃO BRASILEIRA DE NORMAS TÉCNICAS. NBR 13713: instalações hidráulicas prediais: aparelhos automáticos acionados mecanicamente e com ciclo de fechamento automático: requisitos e métodos de ensaio. Rio de Janeiro, 2009.) Brazilian standard (activation time between four and ten seconds).
In toilets and urinals, leaks were identified based on the method described in NBR 15097-1 (ABNT, 2017ASSOCIAÇÃO BRASILEIRA DE NORMAS TÉCNICAS. NBR 15097-1: aparelhos sanitários de material cerâmico: parte 1: requisitos e métodos de ensaios. Rio de Janeiro, 2017.) Brazilian standard. This method consists in flushing the toilets and urinals, and after waiting at least 30 minutes, drying their inner walls, and then using a hydrographic pen to draw a circumference on the ceramic equipment above the water level on toilets or above the drainage holes on urinals. The number of water trickles erasing the drawn circumference count as leaks. The flush type on toilets (valve or tank toilet) and the activation type on urinals valves (manual or automatic closing) were verified.
Drinking fountain sprays were verified (linear or dispersed). The presence of leaks and/or other types of defects were verified on showers, as well as the water heating system (gas or electric showers). The flow rates on taps, drinking fountains, and showers were performed with the water valves fully open and then measured by the gravimetric method, using a beaker, a stopwatch and a precision scale. This method consists of: collecting the water flow using a beaker; measure the time required to collect the water flow; determining the mass of water on a precision scale. The flow rates were calculated as shown in Equation (1) . This procedure was performed three times for each plumbing fixture (including maximum flow rate and 40º±2 ºC flow rate for showers).
Where:
Q: flow rate (L/s);
m: mass of water (kg);
t: timed time (s); e
ρ: specific mass of water (kg/L).
The measured flow rates were compared to the values established by NBR 5626 (ABNT, 1998ASSOCIAÇÃO BRASILEIRA DE NORMAS TÉCNICAS. NBR 12483: chuveiros elétricos: requisitos gerais. Rio de Janeiro, 2015b.), NBR 10281 (ABNT, 2015aASSOCIAÇÃO BRASILEIRA DE NORMAS TÉCNICAS NBR 10281: torneiras: requisitos e métodos de ensaio. Rio de Janeiro, 2015a.), NBR 12483 (ABNT, 2015bASSOCIAÇÃO BRASILEIRA DE NORMAS TÉCNICAS. NBR 12483: chuveiros elétricos: requisitos gerais. Rio de Janeiro, 2015b.) Brazilian standards along with the Leadership in Energy and Environmental Design (LEED) certification for Building Operations and Maintenance (U.S. GREEN…, 2019U.S. GREEN BUILDING COUNCIL. Leadership in Energy and Environmental Design. USGBC LEED v4.1 BD+C Guide, 2019. ) and Alta Qualidade Ambiental - Haute Qualité (AQUA-HQE) certification (FUNDAÇÃO VANZOLINI, 2014FUNDAÇÃO VANZOLINI. Alta Qualidade Ambiental - Haute Qualité. AQUA-HQE: Guia prático do referencial de avaliação da qualidade ambiental do edifício: edifícios não residenciais, 2014. Disponível em: Disponível em: https://vanzolini.org.br/download/Guia_Pratico_Referencial_Avaliacao_Qualidade_Ambiental_Edif%C3%ADcio.pdf . Acesso em: 15 set. 2020.
https://vanzolini.org.br/download/Guia_P...
) (Table 1). NBR 5626 (ABNT, 1998ASSOCIAÇÃO BRASILEIRA DE NORMAS TÉCNICAS. NBR 5626: instalação predial de água fria. Rio de Janeiro, 1998.) presents reference values only for comparison. NBR 10281 (ABNT, 2015aASSOCIAÇÃO BRASILEIRA DE NORMAS TÉCNICAS NBR 10281: torneiras: requisitos e métodos de ensaio. Rio de Janeiro, 2015a.) defines the minimum flow rates on taps. NBR 12483 (ABNT, 2015bASSOCIAÇÃO BRASILEIRA DE NORMAS TÉCNICAS. NBR 12483: chuveiros elétricos: requisitos gerais. Rio de Janeiro, 2015b.) specifies the minimum flow rate on electric showers. The values presented by the LEED and AQUA certifications correspond to the maximum permissible flow rates for certification approval. As these institutions classify buildings in terms of sustainability levels, the values recommended by them were considered as a reference for flow rates that are comfortable for users, but that do not represent excessive water consumption. Therefore, flow rates above the values established by these institutions may be an indication of excessive water consumption. The maximum flow rate was measured on taps and drinking fountains as well as the operating flow time on self-closing taps.
The water heating system was evaluated in the showers to determine the maximum available flow rate and the flow rate at 40°±2 °C. This temperature was adopted because it is the usual and suggested value for a comfortable shower (SIQUEIRA et al., 2014SIQUEIRA, L. B. et al. Comparação entre aquecedores solares com ligações em serpentina e paralela. Blucher Chemical Engineering Proceedings, v. 1, p. 328-334, 2014.). A laser-sighting thermometer was used to measure the water temperature.
The valve on each shower was opened completely to perform the initial determination of the flow rate on electric showers, and then the flow rate and temperature were measured in this condition. Subsequently, the purpose was to stabilize the water temperature at 40°±2 °C so that the flow rate could be measured at this temperature range. It was proposed to leave the switch set to the “winter” mode (both in summer and in winter measurements) on all electric showers to get the hottest possible temperature.
The maximum flow rate was measured when the hot water valve was fully open, and the cold water valve closed on gas showers. The elapsed time from switching on the shower until the water reached a suitable temperature for showering was also measured. As soon as the temperature remained constant, the flow rate was measured as well as its temperature. Both the hot and cold water valves were opened to control the temperature to achieve measurements ranging at 40°±2 °C, and then, the instant the temperature stabilized within those limits, the flow rate was measured, and its temperature was registered. The room temperature was also measured using a laser-sighting thermometer in all visited buildings for comparative purposes.
The measurement procedures carried out on the showers in summer were re-done during winter. Again, room temperature in each building was also measured on the data collection day. The 40°±2 °C temperature measurements were carried out in summer and winter periods to examine the differences in temperature and flow rate in different seasons, comparing the way showers operated in different seasons of the year. Room temperature was checked to analyze the performance of showers due to external temperature variation. The values of flow rates in showers measured in winter were also compared to those defined by NBR 5626 (ABNT, 1998ARAÚJO, L. S. M. de. et al. Avaliação durante operação dos sistemas prediais hidráulicos e sanitários em edifícios escolares. In: CONFERÊNCIA LATINO-AMERICANA DE CONSTRUÇÃO SUSTENTÁVEL, 1.; ENCONTRO NACIONAL DE TECNOLOGIA DO AMBIENTE CONSTRUÍDO, 10., São Paulo, 2004. Anais... São Paulo: ANTAC, 2004.), NBR 12483 (ABNT, 2015bASSOCIAÇÃO BRASILEIRA DE NORMAS TÉCNICAS. NBR 15097-1: aparelhos sanitários de material cerâmico: parte 1: requisitos e métodos de ensaios. Rio de Janeiro, 2017.), LEED for Building Operations and Maintenance (U.S. GREEN…, 2019U.S. GREEN BUILDING COUNCIL. Leadership in Energy and Environmental Design. USGBC LEED v4.1 BD+C Guide, 2019. ) and AQUA-HQE (FUNDAÇÃO VANZOLINI, 2014FUNDAÇÃO VANZOLINI. Alta Qualidade Ambiental - Haute Qualité. AQUA-HQE: Guia prático do referencial de avaliação da qualidade ambiental do edifício: edifícios não residenciais, 2014. Disponível em: Disponível em: https://vanzolini.org.br/download/Guia_Pratico_Referencial_Avaliacao_Qualidade_Ambiental_Edif%C3%ADcio.pdf . Acesso em: 15 set. 2020.
https://vanzolini.org.br/download/Guia_P...
).
Lastly, questionaires were filled out by the users in each building, asking them about the conditions of showers and their frequency of use. The selection method applied to the sample of users who would answer the questionnaires was convenience sampling, a non-probabilistic method, whereas the researcher selects the accessible participants to compose the sample (ETIKAN; MUSA; ALKASSIM, 2016ETIKAN, I.; MUSA, S. A.; ALKASSIM, R. S. Comparison of Convenience Sampling and Purposive Sampling. American Journal of Theoretical and Applied Statistics, v. 5, p. 1-4, 2016. ). Questionnaires were not filled out in Building V because it is a Stadium, and thus there is a wide variation in the user population. After collecting 134 answers, an assessment of these results was then carried out.
After in situ measurements, calculations and graphs, specific reports containing obtained data were made available to the respective managers of each building in order to make them aware of the current situation. The reports were prepared according to the floor plans of the buildings, provided by the building administration. A unique nomenclature was created to facilitate the identification of each plumbing fixture in the floor plans and graphs of each report, specifying the observed characteristics. Any problems that the plumbing fixture eventually presented were also pointed out, in addition to the opinions of the users registered in the questionnaires.
Results
The first phase of this research evaluated the maximum flow rates and 40°±2 °C flow rates in showers; the measurements were performed during summer. Simultaneously, all other plumbing fixtures were also measured regarding their flow rates. Plumbing fixtures such as taps, toilets, urinals, and drinking fountains were assessed on all their overall data. In the second phase, in winter, only the 40°±2 °C temperature measurements in showers were re-done for comparison purposes, because those are the only plumbing fixtures in the studied buildings where hot water was supplied. Concomitantly, the questionnaires were filled out.
Six hundred and seven (607) plumbing fixtures were assessed in all five visited buildings. Figure 1 shows the distribution of plumbing fixtures in each building. Building V has the highest number of plumbing fixtures (441), followed by Buildings I and II (67 each), Building III (23) and Building IV (9).
Showers
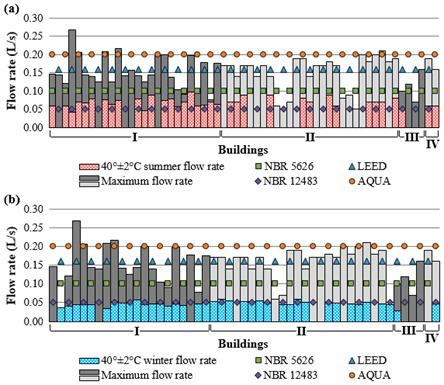
Ninety-one (91) showers were assessed: 65 electric showers installed in Buildings I to IV (Gyms) and 26 gas showers in Building V (Stadium). Figure 2a displays the 40°±2 °C flow rates in electric showers during summer. Flow rates at this temperature were quite below the maximum, and two electric showers registered flow rate below the minimum. Of the operating electric showers, 35.6% did not achieve the desired temperature or were burnt, and therefore were not considered in Figure 2a.
In the Gyms, two electric showers were out of service during summer but operating in winter so that they were able to be assessed during that season. Also, ten electric showers operated normally in summer but were removed, restricted, had no water supply, or had damaged valves during winter, making measurements at this stage impossible. Winter 40°±2 °C flow rates are presented in Figure 2b. 71.1% of the measured flow rates were below the minimum and the values are lower than those measured in summer, increasing discomfort during that season.
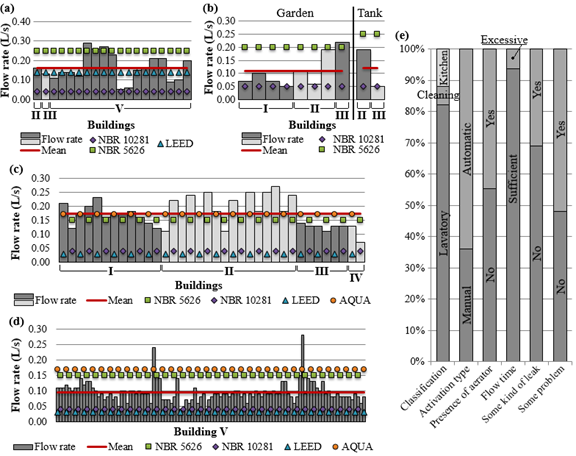
Figure 3a and Figure 3b respectively show the available maximum flow rates in the buildings, with water temperatures for each maximum flow rate. Measurements made with fully open valves showed that no electric shower presented flow rate below the minimum (0.05 L/s) established by NBR 12483 (ABNT, 2015bASSOCIAÇÃO BRASILEIRA DE NORMAS TÉCNICAS. NBR 12483: chuveiros elétricos: requisitos gerais. Rio de Janeiro, 2015b.). It also shows that 45.8% and 8.5% of electric showers registered flow rates above the maximum flow rates established by LEED and AQUA, respectively, which may lead to excessive water consumption in these electric showers.


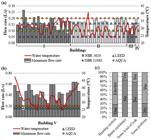
Maximum flow rates and overall data on showers: (a) maximum flow rates of electric showers at the Gyms and the respective water temperature; (b) maximum flow rates of gas showers at the Stadium and the respective water temperature; (c) overall data of all showers at the Gyms and Stadium
The gas showers operating in summer showed that 95.8% of them had maximum flow rates (hot valve fully open) above the values established by LEED and AQUA (Figure 3b). Two gas showers reached the desired temperature with maximum flow rate and three registered temperatures higher than 40°±2 °C. Also, only two gas showers supplied water at 40°±2 °C during summer, and both presented 40°±2°C flow rates above the established maximum values. In summer, despite having a higher room temperature (around 25 °C), the system was unable to heat water up to 40°±2 °C. On the other hand, in winter, at 20 °C (room temperature), almost all gas showers operated at the 40°±2 °C flow rate. 25.0% of 40°±2 °C flow rates in winter were above LEED and 18.8% above AQUA maximum requirements.
According to the Stadium administration, during summer measurements, only one of the two heated water reservoirs was available to operate and provide hot water for the gas showers. In winter, both heated water reservoirs were operating. Thus, heating was inefficient in summer measurements, therefore, this system running at only half capacity is insufficient to meet the hot water demand.
Figure 3c shows the overall data collected from all showers (both electric and gas). Overall, there was some kind of leak (21.7%) and some kind of problem in 69.2% of the showers, such as dispersed sprays, broken, or stuck valves, leaks through the wall or shower hose, no water flow, and even consumption points without any showerheads. Regarding electric showers, 16.9% had a burnt resistance during the measurements.
The waiting time for the hot water (40°±2 °C) in gas showers was also observed, although in some showers it was not possible to reach that temperature. The volume of wasted cold water was also measured. The collected data in summer defined an average waiting time of 1.25 minutes for the water to heat up to 40°±2 °C and the average wasted volume of water was 28.11 liters. On the other hand, in winter, the wasted volume of water was registered as 2.07 liters in 9.26 seconds. This is also justified due to an inadequate gas heating operation. This shows how maintenance throughout the entire building (and not only on plumbing fixtures) can effectively influence consumption. Even in a colder period, less was consumed, while in the hotter season, the amount of water consumed was much higher to reach the 40°±2 °C temperature.
The electric showers provided an average flow rate substantially lower than gas showers. Results show that, to obtain 40°±2 °C, the flow rate must be significantly reduced in electric showers and even lower in winter. Commonly, gas showers present significantly higher flow rates than electric showers (NOGUEIRA et al., 2015NOGUEIRA, L. A. H. et al. Evaluation of the energy impacts of the Energy Efficiency Law in Brazil. Energy for Sustainable Development, v. 24, p. 58-69, 2015. ). Similarly, to achieve higher temperatures, it is necessary to reduce the flow rate in electric showers (Table 2).
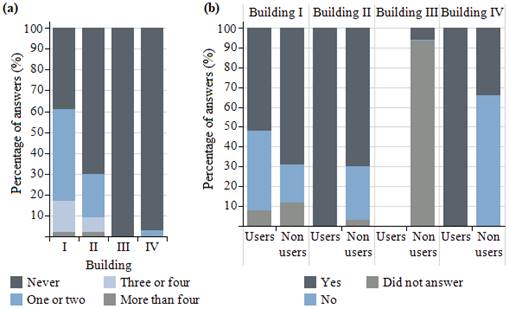
The questionnaires were filled out by 111 athletes in the four Gyms to investigate the frequency of shower usage and its conditions based on users’ opinions. According to Figure 4a, no one takes showers in Building III, which presented the lowest flow rates both in summer and winter, so this may justify the lack of use. Although there are no average flow rates below the minimum standards as established by NBR 12483 (ABNT, 2015bASSOCIAÇÃO BRASILEIRA DE NORMAS TÉCNICAS. NBR 12483: chuveiros elétricos: requisitos gerais. Rio de Janeiro, 2015b.) in Buildings I, II, and IV, the percentage of users is higher than non-users only in Building I, therefore, it can be concluded that the flow rate is not the only factor influencing the use of showers in these buildings.
Out of all users, 69.2% would increase shower usage if their performance were improved (Figure 4b). Also, 46.3% of non-users were also likely to start using these showers if they were in better condition.
According to Figure 5, the most reported defect by Gym users was the water temperature, as 23.0% of them complained that water did not reach the desired temperature. Low pressure is the second most cited defect in the list, pointed out by 14.0% of users, followed by low flow rate (13.0%). Among other problems, low flow rate and oscillating water temperature were also recurring answers.

Questionnaire answers: (a) question: “How often do you make use of showers weekly at Gym?”; (b) question: “In better conditions, would you increase the usage or would you start using the showers at Gym?”

Taps
One hundred and seventy-five taps (175) taps were assessed and classified as kitchen, cleaning, or lavatory taps. All measured kitchen taps presented flow rates (0.16 L/s on average with a Standard Deviation (SD) of 0.069) above the minimum established by NBR 10281 (ABNT, 2015aASSOCIAÇÃO BRASILEIRA DE NORMAS TÉCNICAS NBR 10281: torneiras: requisitos e métodos de ensaio. Rio de Janeiro, 2015a.) (Figure 6a). Likewise, cleaning taps were subdivided as garden or washing tank in Figure 6b. All the flow rates of the cleaning taps were above the minimum required, but 90.0% of the flow rates were still below the NBR 5626 (ABNT, 1998ASSOCIAÇÃO BRASILEIRA DE NORMAS TÉCNICAS. NBR 5626: instalação predial de água fria. Rio de Janeiro, 1998.) reference standard. Water flow averages were 0.11 L/s (SD = 0.063) and 0.12 L/s (SD = 0.099) for garden and washing tank taps, respectively.
Lavatory taps were the most common type of taps throughout the buildings. At the Gyms, the maximum flow rate as established by AQUA was exceeded in 41.7% of taps (Figure 6c). Almost all taps in the Stadium displayed flow rates below the recommended by NBR 5626 (ABNT, 1998ASSOCIAÇÃO BRASILEIRA DE NORMAS TÉCNICAS. NBR 5626: instalação predial de água fria. Rio de Janeiro, 1998.), but they still were all above the minimum established by NBR 10281 (ABNT, 2015aASSOCIAÇÃO BRASILEIRA DE NORMAS TÉCNICAS NBR 10281: torneiras: requisitos e métodos de ensaio. Rio de Janeiro, 2015a.), as shown in Figure 6d.
Figure 6e shows that 64.0% of taps presented self-closing devices and displayed good performance in 93.7% of cases regarding the flow rate time, compliant with the limits as defined in NBR 13713 (ABNT, 2009ASSOCIAÇÃO BRASILEIRA DE NORMAS TÉCNICAS. NBR 13713: instalações hidráulicas prediais: aparelhos automáticos acionados mecanicamente e com ciclo de fechamento automático: requisitos e métodos de ensaio. Rio de Janeiro, 2009.). Aerators are devices for saving water, and they were present on only 44.6% of taps. Despite this, there were 30.9% of taps with some leakage, and at least 52.0% showed some defect, such as dispersed spray, missing parts, no water flow, consumption point with no tap, oscillating flow rate, and loose or broken taps.
Toilets and urinals
A total of 216 toilets and 113 urinals were assessed. Almost all urinals were installed in Building V (there were 109 of them), while there were no urinals in Buildings III and IV. Several trickles were verified in toilets, an average of 3.4 trickles per toilet and a SD of 3.556 for the Gyms and 3.8 trickles per toilet with SD = 3.183 in the Stadium. The overall average was 3.7 trickles per toilet (SD = 3.271), including all the buildings. Data from Figure 7a shows 77.8% of toilets trickled. Almost all toilets presented self-closing flush valves, but some of these leaked or were broken or unfinished (7.4%). However, at least 88.0% of toilets displayed some problem, such as loose parts, no water flow, clogging, or unusable, as well as those that had been previously identified.
There were only trickles on the urinals in the Stadium, affecting 64.0% of these plumbing fixtures. Mostly, there was only one trickle per urinal, resulting in an average of 1.4 trickles and SD = 0.752. The overall data in Figure 7b highlighted that although 98.2% of urinal valves were automatically self-closing, some of these valves still leaked, besides the mentioned trickles. This emphasizes the idea that periodic revision is essential on all plumbing fixtures as well as eventual maintenance, even though there are water-saving devices installed. Overall, 71.9% of urinals displayed some problem, such as broken, stuck, or unfinished valves or unavailability, as well as the previously expressed problems.

Flow rates and overall data on taps: (a) flow rates of kitchen taps at the Gyms and the Stadium; (b) flow rates of cleaning taps at the Gyms and the Stadium; (c) flow rates of lavatory taps at the Gyms; (d) flow rates of lavatory taps at the Stadium; (e) overall data of all taps at the Gyms and the Stadium

Drinking fountains
Drinking fountains were the fewest plumbing fixtures in all five buildings; only twelve were assessed and four drinking fountains presented two jet devices. Figure 8a shows most of the drinking fountains as low flow rates, with a mean of 0.02 L/s (SD = 0.010), and all below the NBR 5626 (ABNT, 1998ASSOCIAÇÃO BRASILEIRA DE NORMAS TÉCNICAS. NBR 5626: instalação predial de água fria. Rio de Janeiro, 1998.) reference. Figure 8b shows some drinking fountains with dispersed sprays when pressed (10.5%), making water drinking difficult for users, also causing wasted water. Furthermore, 68.4% were free from leaks, and 58.3% did not show any type of malfunction. Some different problems were loose, stuck, or removed push buttons and creased structures.
Discussion
The performance evaluation of installed plumbing fixtures in buildings is important for planning actions that guarantee efficient service levels based on quality and sustainability standards. A maintenance prioritization plan could be very valuable for sports facilities, once the financial resources for maintenance procedures in public buildings are often not enough to attend its demands (SHEN, 1997SHEN, Q. A comparative study of priority setting methods for planned maintenance of public buildings. Facilities, v. 15, p. 331-339, 1997. ). Therefore, the presented results can make these plans easier to be accomplished by the building managers. Toilets represent 35.6% of all plumbing fixtures and 53.6% of the fixtures that presented some kind of leak in this study, so maintaining toilets should be one of the priorities. Fujimoto, Nunes e Ilha (2002FUJIMOTO, R. K.; NUNES, S. S.; ILHA, M. S. de O. Análise dos testes de detecção de vazamentos em bacias sanitárias. In: ENCONTRO NACIONAL DE TECNOLOGIA DO AMBIENTE CONSTRUÍDO, 9., Foz do Iguaçu, 2002. Anais... Foz do Iguaçu: ENTAC, 2002.) also state that a relatively large percentage of water consumption in their research may be due to the occurrence of toilet leaks, which are imperceptible by users. As a result, periodic maintenance activities on these devices are often not performed. The authors also indicated the pen method by NBR 15097-1 (ABNT, 2017ASSOCIAÇÃO BRASILEIRA DE NORMAS TÉCNICAS. NBR 15097-1: aparelhos sanitários de material cerâmico: parte 1: requisitos e métodos de ensaios. Rio de Janeiro, 2017.) as the preferred test in case of a large number of toilets to be measured, which is the case of this research, because of its practicality and economy compared to other methods. Even though the pen method could not quantify the wasted water volume, it allows identifying which toilets present leaks and need corrective maintenance.
41.7% of Gym taps exceeded the flow rate established by AQUA. Silva et al. (2014)SILVA, S. F. et al. Rational consumption of water in administrative public buildings: the experience of the Bahia administrative center, Brazil. Water, v. 6, n. 9, p. 2552-2574, 2014. also found in administrative public buildings a great percentage of taps which had flow rate above the recommended by technical standard, reaching over 80% of self-closing taps and 90% of mechanical taps. Silva et al. (2014)SILVA, S. F. et al. Rational consumption of water in administrative public buildings: the experience of the Bahia administrative center, Brazil. Water, v. 6, n. 9, p. 2552-2574, 2014. suggested adjustments of flow rates in plumbing fixtures as one of the most important corrective actions.
On the other hand, Gonçalves, Kalbusch e Henning (2018GONÇALVES, F.; KALBUSCH, A.; HENNING, E. Correlation between water consumption and the operating conditions of plumbing fixtures in public buildings. Water Supply, v. 18, p. 1915-1925, 2018. ) found a very strong statistical correlation between the number of lavatory taps with flow rate below the minimum and the average monthly consumption in ten administrative public buildings. Results like this may raise the awareness that, even with water-saving devices installed and an apparently economical flow rate, periodic monitoring is necessary for identifying eventual leaks and other problems that increase consumption and nullify the benefits of these devices.

Flow rates and overall data on drinking fountains at the Gyms and the Stadium: (a) flow rates; (b) overall data
It is interesting to note that all flow rates in drinking fountains operated quite below the Brazilian standard NBR 5616 (ABNT, 1998ASSOCIAÇÃO BRASILEIRA DE NORMAS TÉCNICAS. NBR 5626: instalação predial de água fria. Rio de Janeiro, 1998.) in this study. The same phenomenon was observed in the drinking fountains measured by Kalbusch et al. (2018KALBUSCH, A. et al. Avaliação das condições de operação de equipamentos hidrossanitários em edificações públicas (Evaluation of operating conditions of plumbing fixtures in public buildings). Ambiente Construído, Porto Alegre, v. 18, n 1, p. 393-408, jan./mar. 2018. ) in public offices. The policy of lower prices is applied in the public sector in Brazil and, therefore, quality programs, which attest the conformity of products with Brazilian standards and publicize non-compliant companies, are extremely important in the specification of products in the public sector (ARAÚJO et al., 2004ARAÚJO, L. S. M. de. et al. Avaliação durante operação dos sistemas prediais hidráulicos e sanitários em edifícios escolares. In: CONFERÊNCIA LATINO-AMERICANA DE CONSTRUÇÃO SUSTENTÁVEL, 1.; ENCONTRO NACIONAL DE TECNOLOGIA DO AMBIENTE CONSTRUÍDO, 10., São Paulo, 2004. Anais... São Paulo: ANTAC, 2004.). Thus, the importance of comparing the performance of plumbing fixtures with the values established by Brazilian standards and certifications is highlighted, as carried out in this research. Designing for public buildings is more complex than for private residences, as the daily number of users in public facilities can be very variable, hence this number is usually estimated (FARINA et al., 2011FARINA, M. et al. Water consumptions in public schools. Procedia Engineering, v. 21, p. 929-938, 2011. ). Along with that, there is the fact that the majority of public users are not directly responsible for the fixtures’ management, which may explain the amount of 71.7% of plumbing fixtures with non-compliant characteristics found in this research.
The plumbing fixtures’ performance analysis may also be essential to choose the most appropriate water-saving strategy for each building. Cureau and Ghisi (2019CUREAU, R. J.; GHISI, E. Reduction of potable water consumption and sewage generation on a city scale: a case study in Brazil. Water, v. 11, p. 1-16 , 2019. ) state that this may vary depending on particular characteristics of each building, such as water end-uses and total water demand of the building. So the plumbing fixtures performance analysis could be the first step for identifying the fixtures that should be prioritized on water-saving strategies, as it allows identifying fixtures with more occurrence of leaks or other problems.
Roccaro, Falciglia and Vagliasindi (2011ROCCARO, P.; FALCIGLIA, P. P.; VAGLIASINDI, F. G. A. Effectiveness of water saving devices and educational programs in urban buildings. Water Science and Technology, v. 63, p. 1357-1365, 2011. ) state that some urban areas lack water conservation awareness and the literature does not always indicate the real water consumption values, especially for public buildings. This reinforces why in-situ measurements are so important to check the actual situation in order to allow the development of necessary improvements. The authors also assert that water saving measures were able to save up to 60% of water consumed in public buildings, which was even higher than in the residential buildings they analyzed. Maintenance regarding the identified leakage points could be very valuable, since 55.0% of all plumbing fixtures presented some kind of leak in the visited sports facilities.
Although in most countries retrofit rate is very low for public buildings, simple measures as the installation of tap aerators work as a low-cost and quite effective solution, with a short payback period potential, leading to water consumption reduction (BERTONE et al., 2018bBERTONE, E. et al. Guidelines, barriers and strategies for energy and water retrofits of public buildings. Journal of Cleaner Production, v. 174, p. 1064-1078, 2018b. ). That said, as 55.4% of taps in the five buildings analyzed for this research still do not have aerators, their implementation is recommended, as it could generate water savings.
Therefore, plumbing fixtures performance analysis is important to identify which devices should be prioritized in maintenance plans and to choose the most appropriate water-saving strategy for each case. It was not possible to determine water end-uses or water consumption indicators as most analyzed buildings do not have individual water meters. However, detailed reports containing measured data were made available to the respective managers of each building in order to enable the identification of leaks or other defects.
Conclusions
This study sought to evaluate the performance of plumbing fixtures in five public buildings used for sports activities, considering a variety of factors. The conclusion was, as these are public installations, that there is much to be done regarding the maintenance of plumbing fixtures.
In winter, the average 40°±2 °C flow rate was observed as relatively lower than during summer. Gas showers registered greater flow rate than showers operating by electric resistance, as the mean difference between these two types was 0.29 L/s. Considering all types of taps, 52.0% showed some defect, such as leaks, dispersed spray, missing or broken taps, loose parts, no water flow and oscillating flow rate, which may lead to water waste or may cause discomfort to users (athletes, employees and spectators). Toilets were the most common devices in all the buildings and 77.8% of them displayed trickles. Although 98.2% of urinals had automatic valves, aiming to save water in each flush, more than half of them trickled (64.0%). This shows that installing water-saving technologies is meaningless if they are not properly maintained.
Out of all plumbing fixtures, 71.7% were diagnosed as having some sort of problem. This reveals the importance of performing preventive and corrective maintenance in these plumbing fixtures to keep them in proper and safe operating conditions, ensuring an operating system adherent to the established standards. The maintenance of a building must be periodic so that it remains in good performance. Monitoring overall efficiency is essential, whether in hydraulic or heating systems. These measures contribute to water savings and help maintain environmental sustainability.
All these in-situ measurements served to identify the points in which there is wasted water and define what kind of problems are the most recurrent on each plumbing fixture. This research contributes as an initial step before adopting new strategies for water saving. More data collection is suggested for future studies in order to estimate other information, such as water end-uses, water consumption indicators, rating curves and potential for potable water savings. Assessing whether there has been an improvement in the management of building hydraulic systems after the delivery of reports to managers is also suggested.
References
- ARAÚJO, L. S. M. de. et al Avaliação durante operação dos sistemas prediais hidráulicos e sanitários em edifícios escolares. In: CONFERÊNCIA LATINO-AMERICANA DE CONSTRUÇÃO SUSTENTÁVEL, 1.; ENCONTRO NACIONAL DE TECNOLOGIA DO AMBIENTE CONSTRUÍDO, 10., São Paulo, 2004. Anais... São Paulo: ANTAC, 2004.
- ASSOCIAÇÃO BRASILEIRA DE NORMAS TÉCNICAS NBR 10281: torneiras: requisitos e métodos de ensaio. Rio de Janeiro, 2015a.
- ASSOCIAÇÃO BRASILEIRA DE NORMAS TÉCNICAS. NBR 12483: chuveiros elétricos: requisitos gerais. Rio de Janeiro, 2015b.
- ASSOCIAÇÃO BRASILEIRA DE NORMAS TÉCNICAS. NBR 13713: instalações hidráulicas prediais: aparelhos automáticos acionados mecanicamente e com ciclo de fechamento automático: requisitos e métodos de ensaio. Rio de Janeiro, 2009.
- ASSOCIAÇÃO BRASILEIRA DE NORMAS TÉCNICAS. NBR 15097-1: aparelhos sanitários de material cerâmico: parte 1: requisitos e métodos de ensaios. Rio de Janeiro, 2017.
- ASSOCIAÇÃO BRASILEIRA DE NORMAS TÉCNICAS. NBR 5626: instalação predial de água fria. Rio de Janeiro, 1998.
- BERTONE, E. et al Guidelines, barriers and strategies for energy and water retrofits of public buildings. Journal of Cleaner Production, v. 174, p. 1064-1078, 2018b.
- BERTONE, E. et al Role of financial mechanisms for accelerating the rate of water and energy efficiency retrofits in Australian public buildings: Hybrid Bayesian Network and System Dynamics modelling approach. Applied Energy, v. 210, p. 409-419, 2018a.
- BERTONE, E. et al State-of-the-art review revealing a roadmap for public building water and energy efficiency retrofit projects. International Journal of Sustainable Built Environment, v. 5, p. 526-548, 2016.
- CHENG, C. L. et al Relationship between building hot water usage and energy and carbon reduction. Building Services Engineering Research and Technology, v. 37, p. 682-693, 2016.
- CUREAU, R. J.; GHISI, E. Reduction of potable water consumption and sewage generation on a city scale: a case study in Brazil. Water, v. 11, p. 1-16 , 2019.
- ETIKAN, I.; MUSA, S. A.; ALKASSIM, R. S. Comparison of Convenience Sampling and Purposive Sampling. American Journal of Theoretical and Applied Statistics, v. 5, p. 1-4, 2016.
- FARINA, M. et al Water consumptions in public schools. Procedia Engineering, v. 21, p. 929-938, 2011.
- FUJIMOTO, R. K.; NUNES, S. S.; ILHA, M. S. de O. Análise dos testes de detecção de vazamentos em bacias sanitárias. In: ENCONTRO NACIONAL DE TECNOLOGIA DO AMBIENTE CONSTRUÍDO, 9., Foz do Iguaçu, 2002. Anais... Foz do Iguaçu: ENTAC, 2002.
- FUNDAÇÃO VANZOLINI. Alta Qualidade Ambiental - Haute Qualité. AQUA-HQE: Guia prático do referencial de avaliação da qualidade ambiental do edifício: edifícios não residenciais, 2014. Disponível em: Disponível em: https://vanzolini.org.br/download/Guia_Pratico_Referencial_Avaliacao_Qualidade_Ambiental_Edif%C3%ADcio.pdf Acesso em: 15 set. 2020.
» https://vanzolini.org.br/download/Guia_Pratico_Referencial_Avaliacao_Qualidade_Ambiental_Edif%C3%ADcio.pdf - GONÇALVES, F.; KALBUSCH, A.; HENNING, E. Correlation between water consumption and the operating conditions of plumbing fixtures in public buildings. Water Supply, v. 18, p. 1915-1925, 2018.
- KALBUSCH, A. et al Avaliação das condições de operação de equipamentos hidrossanitários em edificações públicas (Evaluation of operating conditions of plumbing fixtures in public buildings). Ambiente Construído, Porto Alegre, v. 18, n 1, p. 393-408, jan./mar. 2018.
- NOGUEIRA, L. A. H. et al Evaluation of the energy impacts of the Energy Efficiency Law in Brazil. Energy for Sustainable Development, v. 24, p. 58-69, 2015.
- NUNES, L. G. C. F. et al Rational water use indicators for public schools in Recife, Brazil. Water Science and Technology: Water Supply, v. 19, p. 207-215, 2018.
- PACHECO, M.; LAMBERTS, R. Assessment of technical and economical viability for large-scale conversion of single family residential buildings into zero energy buildings in Brazil: climatic and cultural considerations. Energy Policy, v. 63, p. 716-725, 2013.
- PIMENTEL, D. et al Energy efficiency and conservation for individual Americans. Environment, Development and Sustainability, v. 11, p. 523-546, 2009.
- PLAPPALLY, A. K.; LIENHARD V, J. H. Energy requirements for water production, treatment, end use, reclamation, and disposal. Renewable and Sustainable Energy Reviews, v. 16, p. 4818-4848, 2012.
- ROCCARO, P.; FALCIGLIA, P. P.; VAGLIASINDI, F. G. A. Effectiveness of water saving devices and educational programs in urban buildings. Water Science and Technology, v. 63, p. 1357-1365, 2011.
- SANGOI, J. M.; GHISI, E. Energy Efficiency of Water Heating Systems in Single-Family Dwellings in Brazil. Water, v. 11, p. 1-18, 2019.
- SHEN, Q. A comparative study of priority setting methods for planned maintenance of public buildings. Facilities, v. 15, p. 331-339, 1997.
- SILVA, S. F. et al Rational consumption of water in administrative public buildings: the experience of the Bahia administrative center, Brazil. Water, v. 6, n. 9, p. 2552-2574, 2014.
- SIQUEIRA, L. B. et al Comparação entre aquecedores solares com ligações em serpentina e paralela. Blucher Chemical Engineering Proceedings, v. 1, p. 328-334, 2014.
- U.S. GREEN BUILDING COUNCIL. Leadership in Energy and Environmental Design. USGBC LEED v4.1 BD+C Guide, 2019.
- ZUCCARI, F.; SANTIANGELI, A.; ORECCHINI, F. Energy analysis of swimming pools for sports activities: cost effective solutions for efficiency improvement. Energy Procedia, v. 126, p. 123-130, 2017
Publication Dates
-
Publication in this collection
13 Nov 2020 -
Date of issue
Jan-Mar 2021
History
-
Received
16 Dec 2019 -
Accepted
19 Feb 2020