Abstract
Adding TiO2 tocoating mortars is carried out to promote self-cleaning through photocatalytic activity. However, this addition influences the workability of the mortar and, consequently, the application stage as the TiO2 used can present a large number of fine particles and a high surface area, increasing the demand for mixing water, requiring consistency adjustments before coating. In this work, three mortars (two with the addition of different types of TiO2 and one reference) were developed on a laboratory scale to maintain similar workability, using the flow table test. The amount of kneading water was changed to maintain a spread of 220 ± 10 mm and the content of air-entrained was kept constant, around 25%. The mortars were evaluated using the squeeze flow method. Then, a blind test was performed to assess the mason sensitivity during handling and application of the coating, and all mortars were considered similar. However, the yield of the compositions with TiO2 addition was lower compared to the reference composition, making it possible to explain the results based on the physical parameters of the formulations and with a more in-depth analysis of the rheological indices obtained by the squeeze flow test.
Keywords:
Photocatalytic mortar; TiO2; Squeeze flow; Rheology; Yield
Resumo
A adição do TiO 2 em argamassas de revestimento é realizada para promover a autolimpeza por meio da atividade fotocatalítica. Contudo, a adição influencia a trabalhabilidade da argamassa e, consequentemente, a etapa de aplicação, visto que o TiO 2 utilizado pode apresentar grandes quantidades de partículas finas e elevada área superficial, aumentando a demanda por água de amassamento, necessitando de ajustes de consistência antes da execução do revestimento. Neste trabalho, três argamassas (duas com adição de diferentes tipos de TiO 2 e uma de referência) foram desenvolvidas em escala laboratorial com a finalidade de manter similar trabalhabilidade, utilizando-se o ensaio flow table. Assim, alterou-se a quantidade de água de amassamento para manter um espalhamento de 220±10 mm, e o teor de ar incorporado foi mantido constante, em torno de 25%. As argamassas foram avaliadas utilizando-se o método squeeze flow. Na sequência, foi realizado um teste cego para avaliação da sensibilidade do pedreiro durante o manuseio e aplicação do revestimento, e todas as argamassas foram consideradas similares. Porém, o rendimento das composições com adição TiO 2 foi menor comparado a composição de referência, sendo possível explicar os resultados com base nos parâmetros físicos das formulações e com uma análise mais aprofundada dos índices reológicos obtidos pelo ensaio squeeze flow.
Palavras-chave:
Argamassa fotocatalítica;
TiO
2
; Squeeze flow; Reologia; Rendimento
Introduction
Mechanisms for evaluating the rheological properties of mortars, particularly their applicability, are usually carried out in a sensorial and tactile way and not by their physical behaviour. The mason classifies the mortar according to the ease or difficulty in handling it, for example: hard or soft, cohesive or non-cohesive.
It is common practice for masons to deliberately increase the amount of water without any control, only using their experience and preference of mortar consistency when the mortar does not show the desired characteristic. This procedure often negatively affects the properties of the mortars in the hardened state, such as setting time, shrinkage, low adhesion, high porosity and permeability, and the occurrence of cracks (ISAIA, 2017ISAIA, G. C. (ed.). Materiais de construção civil e princípios de ciência e engenharia de materiais . 3. ed. São Paulo: IBRACON, 2017 ).
Such procedures, based on empirical knowledge, besides being subjective, induce many errors that impair the mortar quality and do not enable us to measure any possible rheological parameters to quantify the material workability. Thus, determining the mortar rheological properties is of fundamental importance, as they guide the purchase decisions of materials, increase durability, productivity, as well as efficiency at construction sites (AZEVEDO et al., 2017AZEVEDO, A. R. G. de et al. Influence of incorporation of glass waste on the rheological properties of adhesive mortar. Construction and Building Materials , v.148, p. 359-368, 2017.).
Additionally, characteristics such as the particle size distribution, real density and the specific surface area are factors that have a great influence on the mortar capacity of withstanding aggressive agents such as water, oxygen, carbon dioxide, chlorides and aggressive solutions (MELO; TRICHÊS, 2017MELO, J.V.S; TRICHÊS, G. Study of the influence of nano-TiO2 on the properties of Portland cement concrete for application on road surfaces. Road Materials Pavement Design , v. 19, p. 1011-1026, 2017.).
In general, it can be admitted that all exterior surfaces are candidates for having photocatalytic properties, as long as they receive sunlight, a source of ultraviolet radiation, essential for the catalysis of chemical reactions through TiO2 (PARAMÊS; BRITO, 2010PARAMÉS, J; BRITO, J. de. Materiais de construção nanotecnológicos de auto-limpeza - Self-cleaning nanotechnologic construction materials. Teoria e Prática na Engenharia Civil , v.15, p. 55-62, 2010. ). However, the addition of TiO2 can lead to a great impact on the fresh state properties of compositions when TiO2 is added in cement-based materials due to the strong tendency towards agglomerate formation due to its ultrafine size (SENF, 2009SENFF, L. Effect of nanosilica on rheology and fresh properties of cement pastes and mortars. Construction and Building Materials , v. 23, p. 2487-2491, 2009.; SENF et al., 2010SENFF, L. et al. Effect of nanosilica and microsilica on the microstructure and the hardened properties of cement pastes and mortars. Advanced Applied Ceramics Journal , v. 109, p. 104-110, 2010.). Therefore, the rheological evaluation of the mortars with TiO2 addition is an important step for developing products with adequate consistency for the in-field application.
The rheological properties of the dispersions are governed by the microstructure of the system. In these systems, the solid particles are relatively small and the interparticle forces are significantly pronounced to influence the microstructure, the aggregation state of the dispersion, and, consequently, the mechanical and rheological properties of the system (MIKULÁĔK; WAKEMAN; MARCHANT, 1997MIKULÁĔK, P.; WAKEMAN, R. J.; MARCHANT, J. Q. The influence of pH and temperature on the rheology and stability of aqueous titanium dioxide dispersions. Chemical Engineering , v. 67, p. 97-102, 1997.). In this context, the squeeze flow test proves to be an excellent alternative and simulates the processing conditions such as spreading, levelling and finishing (CARDOSO; JOHN; PILEGGI, 2009CARDOSO, F. A; JOHN, V. M; PILEGGI, R. G. Rheological behavior of mortars under different squeezing rates. Cement and Concrete Research , v. 39, p. 748-753, 2009. ).
In this study, the rheological properties of mortars with and without TiO2 addition were evaluated on a laboratory scale to define similar workability between them, as well as the mason's sensitivity during the mortar application in-situ correlating the results after both procedures.
Experimental program
In this research, it was observed how the TiO2 addition could affect the rheological properties of rendering mortars. An experimental program was previously performed in the laboratory, monitoring the characteristics in the fresh state, using a consistency test (flow table), air-entrainment, and squeeze flow. In the second stage, the compositions were produced and applied at a construction site, according to the same criteria adopted in the laboratory, observing the maintenance of the characteristics previously determined. The aspects related to the mason's sensitivity to the mortar application were monitored and the final results were correlated with the rheological parameters obtained on a laboratory scale.
Material and methods
Mortars were formulated using white Portland cement (EUROPEAN…, 2000EUROPEAN STANDARD. EN 197-1: cement: part 1: composition, specifications, and conformity criteriafor common cement. Brussels, 2000.), dolomites #20, #40, and #80, an air-entraining agent based on lauryl sulfate molecules, water retention agents based on cellulosic ether molecules and two different commercial samples of powdered TiO2, according to previous evaluations by the authors in Dantas et al. (2019aDANTAS, S. R. A. et al. Influence of the nano TiO2 dispersion procedure on fresh and hardened rendering mortar properties. Construction and Building Materials , v. 215, p. 544-556, 2019a., 2020DANTAS, S. R. A. et al. Influence of polypropylene microfibre (PPMF) dispersion procedure on fresh and hardened rendering mortar properties. Ambiente Construído , Porto Alegre, v. 20, n. 2, p. 7-23, abr./jun. 2020.).
Characteristics of raw material
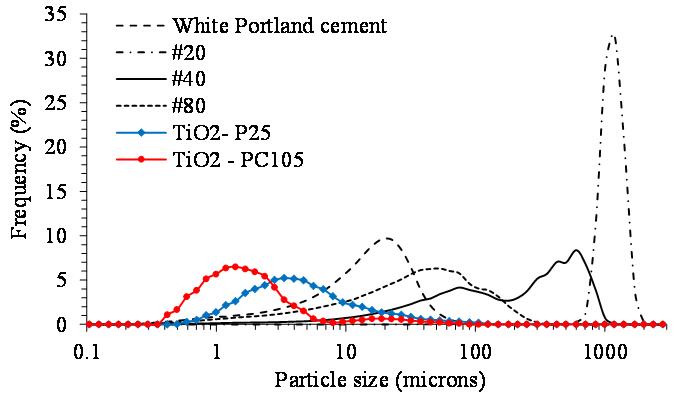
Table 1 shows the specific surface area, real density, and the parameters related to the particle size for raw materials, while Figure 1 illustrates the particle size distribution. All the tests were performed following Dantas et al. (2019aDANTAS, S. R. A. et al. Influence of the nano TiO2 dispersion procedure on fresh and hardened rendering mortar properties. Construction and Building Materials , v. 215, p. 544-556, 2019a., 2020DANTAS, S. R. A. et al. Influence of polypropylene microfibre (PPMF) dispersion procedure on fresh and hardened rendering mortar properties. Ambiente Construído , Porto Alegre, v. 20, n. 2, p. 7-23, abr./jun. 2020.).
Two points can be considered essential for the TiO2 relationship with the mortar rheology, the specific surface area and the particle size presented by each TiO2. Although both samples have a large number of fine particles and the specific surface area has a direct relationship with cement hydration, there are some contradictions related to the TiO2 impacts on the hydration process of the cement matrix (FOLLI et al., 2010FOLLI, A. et al. Engineering photocatalytic cements: understanding TiO2 surface chemistry to control and modulate photocatalytic performances. Journal of the American Ceramic Society , v.93, p. 3360-3369, 2010.; CHEN; KOU; POON, 2012CHEN, J.; KOU, S.-C.; POON, C.-S. Hydration and properties of nano-TiO2 blended cement composites. Cement and Concrete Composites , v. 34, p. 642-649, 2012.; YANG et al., 2015YANG, L.et al. Efects of nano-TiO2 on strength, shrinkage and microstructure of alkali activated slag pastes. Cement and Concrete Composites , v. 57, p. 1-7, 2015.; SALMAN; EWEED; HAMEED, 2016SALMAN, M.M.; EWEED, K.M.; HAMEED, A. M. Influence of partial replacement TiO2 nanoparticles on the compressive and flexural strength of ordinary cement mortar. Al-Nahrain Journal for Engineering Sciences , v.19, p. 265-270, 2016.; HAMIDI; ASLANI, 2019HAMIDI, F.; ASLANI, F. TiO2-based photocatalytic cementitious composites: materials, properties, influential parameters, and assessment techniques. Nanomaterials , v. 9, p. 1-33, 2019.). However, the influence of TiO2 nanoparticles on cement hydration products is subject to debate and will be discussed in another article.
Figure 2 shows the mineralogical composition of white Portland cement and the TiO2 sample by X-ray diffraction and Table 2 illustrates the chemical composition according to that described in Dantas et al. (2019aDANTAS, S. R. A. et al. Influence of the nano TiO2 dispersion procedure on fresh and hardened rendering mortar properties. Construction and Building Materials , v. 215, p. 544-556, 2019a.).
Despite high chemical purity, the two TiO2 samples present differences in their crystalline structures, P25 (rutile + anatase) and PC105 (anatase). The TiO2 crystalline phases have a direct relationship with the bandgap energy, in other words, they are responsible for TiO2 absorption and activation at different wavelengths by solar radiation, where the anatase phase is considered more reactive.
The chemical analysis detected amounts of calcium, silicon, aluminum and iron. Bogue calculation was applied to determine the quantities of the clinker phases. Results indicated the presence of high content of C3S (68.9%) and C2S (9.9%) in the clinker composition, which is also composed of C3A (11.6%) and C4AF (1.0%). A small amount of carbonate was also detected as an addition, but the presence of free lime indicates the incomplete burning during clinker production, showing a cement with common characteristics for the type of binder.


Experimental design
The mixing procedure used to prepare the specimens was done in two different conditions, in a laboratory, and at the construction site, using different mixing equipment but the same steps. The mixing procedure in the laboratory-scale was done according to details by Dantas et al. (2019aDANTAS, S. R. A. et al. Influence of the nano TiO2 dispersion procedure on fresh and hardened rendering mortar properties. Construction and Building Materials , v. 215, p. 544-556, 2019a., 2020DANTAS, S. R. A. et al. Influence of polypropylene microfibre (PPMF) dispersion procedure on fresh and hardened rendering mortar properties. Ambiente Construído , Porto Alegre, v. 20, n. 2, p. 7-23, abr./jun. 2020.), shown briefly below for the convenience of the reader.
Compositions
Comparisons were performed using three sets of mixtures according to that described in Table 3.
Materials were selected based on the assumption of maintaining the same matrix previously evaluated by Dantas et al. (2019aDANTAS, S. R. A. et al. Influence of the nano TiO2 dispersion procedure on fresh and hardened rendering mortar properties. Construction and Building Materials , v. 215, p. 544-556, 2019a.), as shown in Table 4. The water content was changed to maintain the same workability of every mortar. As the TiO2 presents different densities, the consumption of each one in the composition is different, even with a similar percentage purposed.
Laboratory scale mixing procedure
Reference mortar: water and microfibers were mixed with Standard Energy Mix (SEM) for 90 seconds using a Hobart N50 mixer. Then, the powder was added and a period of 30 seconds was given to wet the particles. Then, the mixing was performed for plus 90 seconds.
P25 and PC105 mortars: The TiO2 was dispersed under High Energy Dispersion (HED) with 10,000 rpm for 30 seconds. After that, the microfibers were added, and the mixing was done according to the same procedure described previously.
Fresh state properties
Fresh state properties were evaluated using a flow table test (ABNT, 2016ASSOCIAÇÃO BRASILEIRA DE NORMAS TÉCNICAS. NBR 13276: argamassa para assentamento e revestimento de paredes e tetos: determinação do indice de consistência. Rio de Janeiro, 2016.), squeeze flow test (ABNT, 2010BRAZILIAN ASSOCIATION OF TECHNICAL STANDARDS. NBR 15839: laying mortar and coating of walls and ceilings: rheological characterization by the squeeze-flow method. Rio de Janeiro, 2010.), and air-entrainment using the gravimetric method (ABNT, 2005ASSOCIAÇÃO BRASILEIRA DE NORMAS TÉCNICAS. NBR 13278: argamassa para assentamento e revestimento de paredes e tetos: determinação da densidade de massa e do teor de ar-incorporado. Rio de Janeiro 2005.), as shown in Figures 3 and 4.
Flow table test: the table was wet and the cone was placed at the centre of the table. After that, the cone was filled with fresh mortar in three equal layers. Each layer was tamped 15, 10, and 5 times with a tamping rod. Then, we waited 30 seconds before lifting the cone. After the cone was lifted, the table went up and down 30 times in the 30 s causing the mortar to flow. After this, the flow mortar diameter was measured.


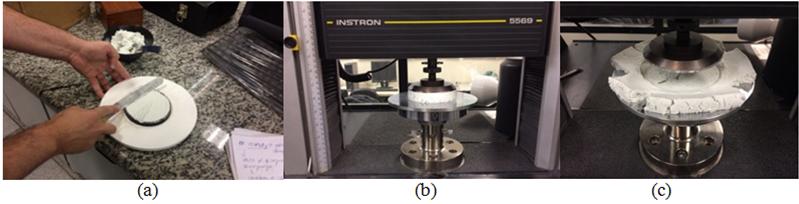
Squeeze flow: conducted on a universal testing machine (Instron 5569) with a 1kN load cell. Samples were prepared in a metallic plate with smooth surfaces to ensure a non-absorption condition, and a PVC cylindric mold (diameter of 101 mm and width of 20 mm) was used. After the molding process, the rigid PVC mold, used as a template, was removed, because the material presented an initial consistency to maintain its shape. In this configuration, the material can deform freely in the radial direction. The sample and the upper disk had the same diameter allowing alignment. The tests were performed using a displacement rate of 0.1 mm/s to a maximum displacement of 18 mm or maximum load of 1kN, as shown in Figure 4.
Squeeze flow results in a load (or tension) per displacement response. There are three phases of the material's behaviour: elastic or low-stress (I), plastic or viscous flow, without a significant increase in tension to maintain the deformation (II) and a high-stress region with flow resistance due to greater particle interaction (III), as shown in Figure 5.
Air-entrainment: tests were performed according to the gravimetric method, using a 400 ml - volume cup, determining the mass needed to fill it. The air-entrainment values were calculated based on the mortar water content and the real density of the dry powder.
Mixing procedure at the construction site
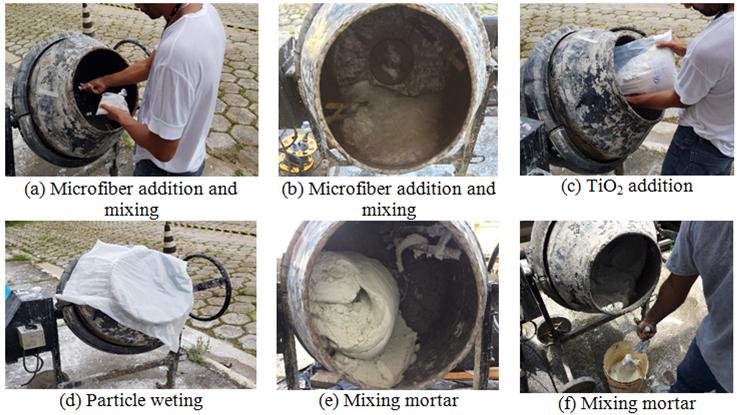
Reference mortar: water was added to the concrete mixer, and then microfibers were added for 3 min with the equipment turned off. After that, the dry powder was added for 1 min with the equipment turned off, and the concrete mixer was covered for 1 min for particle wetting. Hereafter, the equipment was turned on and the mixing was performed for 5 min.
P25 and PC105 mortar: water was added into the concrete mixer, and then microfibers were added for 3 min with the equipment turned off. Afterwards, the TiO2 was added for 3 min with the equipment turned off. After that, the dry powder was added for 1 min with the equipment turned off, and the mixing was done according to the same procedure described previously.
An illustration of the step-by-step mixing is presented in Figure 6.
Applying mortars
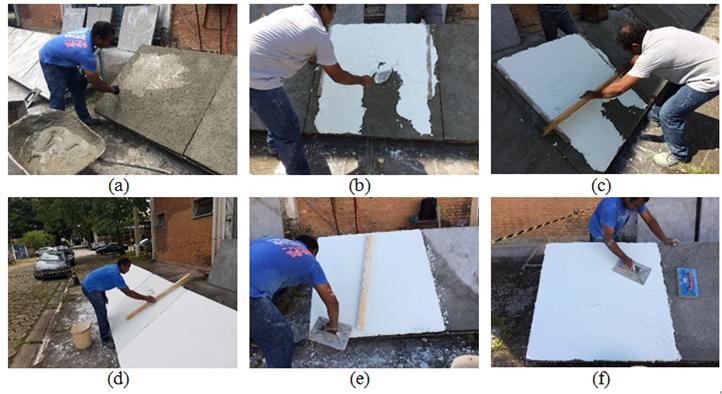
Mortars were applied by a mason on 1.2 m x 1.2 m concrete substrates (panels) aiming to find a maximum thickness of 1 cm as recommended by the literature and with the minimum possible roughness as described in Dantas, Vittorino and Loh (2019bDANTAS, S. R. A; VITTORINO, F; LOH, K. Photocatalytic performance of white cement mortars exposed in urban atmosphere. Global Journal of Research in Engineering: C (Chemical Engineering) , v. 19, n. 2, p. 1-13, 2019b.). First, the preparation of the base for the application of mortar was performed (Figure 7a). To ensure the desired thickness, a wooden template 1 cm high was installed on both sides of the panel (Figure 7b), followed by levelling the mortar (Figure 7c). After the application and levelling of mortar, the finishing process was carried out, as shown in Figures 7d, 7e, 7f and 7f.
Determination of mortar yield
To calculate the mortar yield, the total mass of mortar produced (mt) was annotated at the beginning of the application. The area of application was kept constant (1.2 x 1.2 m) as well as the thickness of 10 mm. Therefore, the volume produced (V) was the same. At the end of the application, the amount remaining (mf) was weighed and the yield was calculated according to what is shown in Equation 1, where each m3 produced represents the use of 1kg of mortar.


Results and discussion
Fresh state properties
Table 5 shows the mortars spreading by the flow table, the air-entrained, and a summary of some quantitative results of the squeeze flow test (the load at the displacement of 10 mm and the displacement at the load of 100 N).
Results indicate that it was not possible to maintain the same amount of kneading water as used in the reference mortar because adding the finer TiO2 particles with their higher specific surface area requires a higher amount of water to recover and separate these particles.
The Brazilian standard does not specify an ideal flow result in flow table tests. Based on previous studies carried out by Dantas et al. (2020)MELO, J.V.S; TRICHÊS, G. Study of the influence of nano-TiO2 on the properties of Portland cement concrete for application on road surfaces. Road Materials Pavement Design , v. 19, p. 1011-1026, 2017., where the target for this kind of test was 220 ± 10 mm, it can be observed that all mortars meet the requirements. Additionally, it was decided to keep the air-entrained around 25%, because the air-bubbles also affect the workability, applicability and yield.
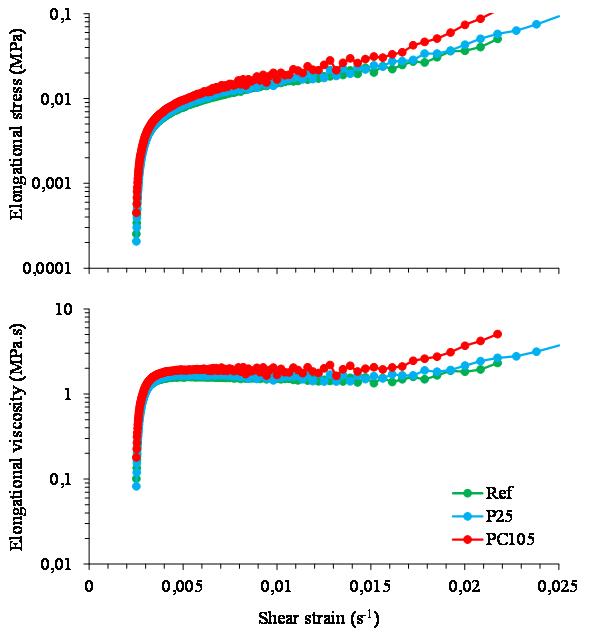
The squeeze flow test is adequate to evaluate mixtures with any level of consistency. To coat with mortars, the test simulates processing conditions such as spreading and finishing. Similar curves indicated that even with the imposition of a more severe shear condition, there was no workability impact. According to the mason, who applied the mortars, the qualitative perception of the consistency of the mortar was also maintained. This is a relevant factor since the flow of the mix is of major importance in real scale applications. Figure 8 shows the results obtained with mortars 5 min after mixing.
Using a small displacement, the mortars behave as a solid exhibiting an elastic deformation, that is, they could be related to the material yield stress. At the first stage, all mortars present a similar behaviour, where the increase of the elongation displacement and radial shear can be observed, exceeding the forces that kept the material under elastic behaviour, indicating that the mortar is flowing.
From this stage, differences in the mortar with TiO2 were observed. The compressive load of the mortar with PC105 in 50% of compressive extension (10 mm) was around 22% higher than the reference mortar and around 15% higher than the P25 mortar. Large deformations without a significant increase in the compressive load may indicate that mortar presents adequate workability and easy application.
At the larger compressive extension, there is a significant increase in the compressive load, even with the material presenting low deformation. This is because the particles are in contact, increasing the frictional forces and a significant interaction through the fibre interlacing, causing some flow restrictive effects. This stage is characterised by the behaviour in this kind of material and tends to be hampered due to the high loads involved, which are obtained after around 70% of the compressive extension of each mortar.

The elongational stress profile (σ B ) and elongational viscosity (η B ) over shear rate (ε B ), according to Equations 2 to 4 (STEFFE, 1996STEFFE, J. F. Rheological methods in food process engineering . 2nd . ed. Michagan: Freeman Press, 1996. ), was based on the results of compressive load vs compressive extension and presented in Figure 9.
AP is the upper disk area, (F) is the compressive obtained force during the test (v) is the speed of the upper disk displacement, (t) is the time, (R) is the upper disk radius, (h) is the sample height at each displacement and (h 0 ) is the initial sample height.
All the mortars were similar and showed an increase in the stress and elongational viscosity values at the low elongational shear strain. On the other hand, at the higher elongational shear strain, the difference between the elongational viscosity and elongational stress, in the mortar with the PC105 addition, showed higher values than other mortars.
A rheological parameter of higher practical interest for mortar application on vertical surfaces is the yield stress. Since the product must have adequate consistency to be applied to the specimens, the use of this theory is appropriate to calculate the yield stress by the squeeze flow method. The yield stress determined indirectly from the profile presented in Figure 5, and which corresponds to the transition point from the region (I) to (II), is related to elongational yield stress. This point is defined based on the intersection of linear extrapolations of these respective phases.
Mortars evaluated in this study did not present a well-defined transition point from elastic to the plastic regime, making it impossible to calculate the yield stress indirectly. The power-law model was used to relate the yield stress (τ 0 ) with the consistency index (K) and rheological coefficient (n) of mortars, as indicated in Equation 5. Where (γ) is the shear rate (DELHAYE; POITOU; CHAOUCHE, 2000DELHAYE, N.; POITOU, A.; CHAOUCHE, M. Squeeze flow of highly concentrated suspensions of spheres. Journal of Non-Newtonian Fluid Mechanics , v. 94, n. 1, p. 67-74, 2000.; ENGMANN; SERVAIS; BURBIDGE, 2005ENGMANN, J.; SERVAIS, C.; BURBIDGE, A. S. Squeeze flow theory and applications to rheometry: a review. Journal of Non-Newtonian Fluid Mechanics , v. 132, n. 1/3, p. 1-27, 2005.).

As the yield stress is unknown, the rheological parameters (n) and (K) can be determined using Equation 6, which corresponds to the normal force applied to the sample in situations where the strain, velocity, and sample area remain constant during the test (STEFFE, 1996STEFFE, J. F. Rheological methods in food process engineering . 2nd . ed. Michagan: Freeman Press, 1996. ; ENGMANN; SERVAIS; BURBIDGE, 2005ENGMANN, J.; SERVAIS, C.; BURBIDGE, A. S. Squeeze flow theory and applications to rheometry: a review. Journal of Non-Newtonian Fluid Mechanics , v. 132, n. 1/3, p. 1-27, 2005.). These conditions were maintained in the squeeze flow test of this study.
Applying the natural logarithm to both sides of Equation 6 we have Equation 7, where (n) corresponds to the slope of the linear part of the curve ln(F) by ln(1/h), (B) is obtained from the intersection with the y-axis, corresponding to Equation 8, and (K) is determined according to Equation 9.
Considering that all mortars presented very close ln(F) vs ln(1/h) curves, the rheological parameters (n) and (K) of the power-law model were illustrated for the reference sample, where the x-axis corresponds to the values of ln(1/h). It is always negative, because as h > 0, then 0 < 1/h < 1 and in this interval the function (ln) assumes negative values. Table 6 shows the values found for each mortar while Figure 10 shows, for illustrative purposes, an example of a curve for calculating the rheological parameters.
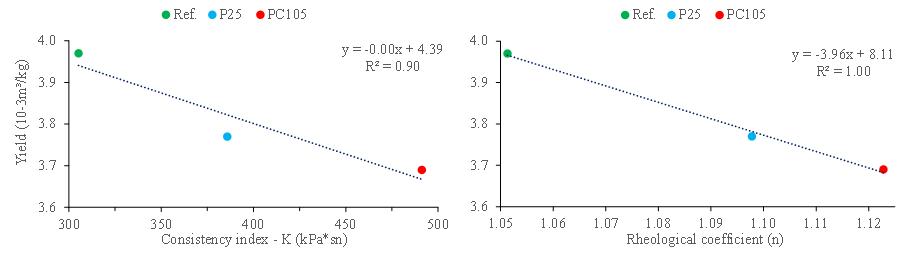
Mortars showed close (n) values, indicating that regardless of the TiO2 addition, the rheological behaviours are similar, however, this trend is not observed for (K) values. The reference mortar presents the lowest value (305.3 kPa.sn), followed by P25 (385.9 kPa.sn, 26.4% higher than Ref.), while the PC105 mortar showed a higher value (491.1 kPa.sn), approximately 61% higher than the reference mortar. Differences in consistency have a direct impact on spreading, as shown by the PC105 mortar, which presented a higher (K) value than the reference and P25 mortars but resulted in lower spreading potential, therefore this can be challenging during the application stage.

Applying the mortars
Mortars evaluated at the laboratory scale have the same consistency using the flow table test, adopting a spread of 220 ± 10 mm. However, the water content varied due to the high TiO2 particle surface area added to the cement matrix (Table 1). Despite that, this test did not provide complete information about the material rheological behaviour, making it necessary to perform the squeeze flow test.
Squeeze flow results showed very small differences in the parameter related to the workability [ (n) and (K) from the Power law equation]. However, these differences were only noticed at the laboratory scale due to the equipment sensitivity. At the construction site, no differences between the mortars were noticed by the professional responsible for the application, in other words, the effort required to handle it was similar. As a result, correction with water in the consistency was not necessary, as is usual in construction sites, using only the water previously defined. Therefore, the mortars developed on a laboratory scale met the objective proposed in this work.
Thus, the changes in the yield were calculated, promoted only using TiO2 (P25 and PC105), according to Equation 1, and the results are shown in Figure 11, illustrating a decrease of approximately 7% when compared to reference mortar. It should be made clear that the calculation of the yield was obtained according to the application made only by one mason and the correlations presented below cannot be discussed as a rule for other types of mortar or when the products are applied by other professionals.
This reduction was correlated to the changes in the mortar's rheological behaviour measured on a laboratory scale, caused by the TiO2 addition, as shown in Figure 12.
Regarding the rheological behaviour, it can be concluded that the TiO2 addition was a major factor that influenced the yield, even with the very small difference observed in the squeeze flow test. Therefore, it was observed that both the rheological coefficient (n) and consistency index (K) presented an excellent correlation with the parameters of mortar application in-situ.
However, the use of finer TiO2 particles resulted in changes in the real density, specific surface area and packing porosity, leading to the necessity for a higher amount of water for mortar mixing, affecting the solid content, corroborating with the studies presented by Senff et al. (2013SENFF, L. et al. Formulation of mortars with nano-SiO2 end nano-TiO2 for degradation of pollutants in buildings. Composites Part B: Engineering , v. 44, n. 1, p. 40-47, 2013., 2015SENFF, L. et al. The influence of TiO2 nanoparticles and polyacrylonitrile fibers on the rheological behavior and hardened properties of mortars. Construction and Building Materials , v. 75, p. 315-330, 2015.) and Joshaghani et al. (2020JOSHAGHANI, A. et al. Effects of nano-TiO2, nano-Al2O3, and nano-Fe2O3 on rheology, mechanical and durability properties of self-consolidating concrete (SCC): An experimental study. Construction Building end Materials , v. 245, 2020.).
A way to combine all these variables in a single factor is by calculating the interparticle separation distance (IPS), according to Equation 10.
Where:
(VSA) is the volumetric surface area (product between the specific area and the real density of the powder);
(Vs) is the volumetric fraction of solids; and
(P of ) is the particle packing porosity.
The IPS can be defined as the average distance between any adjacent particles in the mixture, assuming that they are all separate, that is, not agglomerated (OLIVEIRA et al., 2000OLIVEIRA, I. R. et al. Dispersão e empacotamento de partículas: princípios e aplicações em processamento cerâmico. São Paulo: Fazendo Arte, 2000. ), and significantly influencing the rheological behaviour of mortars.
The IPS concept is particularly applicable to fine particle suspensions, where surface forces are predominant, considering the effect of particle size distribution and predicting particle contact (d=0) when the amount of the liquid phase is lower than the porosity of the packaged system (MACIEL et al., 2018MACIEL, M. H. et al. Effect of the variation of cement consumption on coating mortars produced based on the concepts of mobility and packaging of particles. Ambiente Construido , Porto Alegre, v.18, n. 1, p. 245-259, jan./mar. 2018.). Thus, the results of the yield were also correlated with the IPS to monitor the impact of these physical changes on the compositions during the application in-situ. The results are shown in Figure 13.


Thus, it can be concluded that the proper development of the compositions, based on the concept of IPS and the adequacy of the rheological properties of mortars in the laboratory led to a better understanding of their rheological behaviour, thus enabling the production of different compositions with similar applications, according to the mason's perception.
Conclusions
The results obtained in this study showed:
-
even with the adequacy of mortar fluidity using flow table (spreading 220 ± 10 mm), sensitive rheological differences were detected by the squeeze flow test;
-
the TiO2 type was responsible for the changes in the rheological behaviour of mortar according to the results of consistency index (K) and rheological parameter (𝑛) obtained from the power-law in the results of squeeze flow;
-
regarding the consistency, it was observed that due to the physical characteristics of TiO2, such as a specific surface area, particle size and density, the PC105 mortar presented a slight difficulty in terms of the flow than the reference mortars and with P25;
-
the reference mortar showed the greatest spreading rate and the lower consistency index, reflecting in a higher yield. The PC105 mortar, on the other hand, showed the lower spreading and highest consistency index, resulting in a lower yield, while the P25 mortar presented an intermediate performance;
-
thus, it can be concluded that despite the fact that the workability of mortars with TiO2 was considered similar during the application in the field by the mason, the small differences observed only by the squeeze flow test in the laboratory scale were reflected in the yield; and
-
additionally, changes in yield could be evaluated based on the concept of IPS (interparticle separation distance), which presented excellent correlation, showing the impact of the physical parameters of each composition in the performance during the application.
Acknowledgements
The authors wish to thank the Institute of Technological Research (IPT) and its foundation (FIPT) for the financial and institutional support through the New Talents Program N 01/2017. To the Coordenação de Aperfeiçoamento de Pessoal de Nível Superior- Brazil (CAPES) - Finance Code 001 for the financial support and the Laboratory of Microstructure and Material Eco-efficiency (LME). In the same way, to thank Cristal Pigmentos do Brasil, Votorantim cimentos SA, Neo-Matex, and the Ibratin Industria e Comércio Ltda for the material support to this research work.
References
- AZEVEDO, A. R. G. de et al. Influence of incorporation of glass waste on the rheological properties of adhesive mortar. Construction and Building Materials , v.148, p. 359-368, 2017.
- ASSOCIAÇÃO BRASILEIRA DE NORMAS TÉCNICAS. NBR 13276: argamassa para assentamento e revestimento de paredes e tetos: determinação do indice de consistência. Rio de Janeiro, 2016.
- ASSOCIAÇÃO BRASILEIRA DE NORMAS TÉCNICAS. NBR 13278: argamassa para assentamento e revestimento de paredes e tetos: determinação da densidade de massa e do teor de ar-incorporado. Rio de Janeiro 2005.
- BRAZILIAN ASSOCIATION OF TECHNICAL STANDARDS. NBR 15839: laying mortar and coating of walls and ceilings: rheological characterization by the squeeze-flow method. Rio de Janeiro, 2010.
- ASSOCIAÇÃO BRASILEIRA DE NORMAS TÉCNICAS. NBR 16697: cimento Portland: requisites. Rio de Janeiro, 2018.
- CARDOSO, F. A; JOHN, V. M; PILEGGI, R. G. Rheological behavior of mortars under different squeezing rates. Cement and Concrete Research , v. 39, p. 748-753, 2009.
- CARDOSO, F. A; JOHN, V. M; PILEGGI, R. G. Squeeze-flow aplicado a argamassas de revestimentos: manual de utilização . São Paulo: EPUSP, 2010
- CHEN, J.; KOU, S.-C.; POON, C.-S. Hydration and properties of nano-TiO2 blended cement composites. Cement and Concrete Composites , v. 34, p. 642-649, 2012.
- DANTAS, S. R. A; VITTORINO, F; LOH, K. Photocatalytic performance of white cement mortars exposed in urban atmosphere. Global Journal of Research in Engineering: C (Chemical Engineering) , v. 19, n. 2, p. 1-13, 2019b.
- DANTAS, S. R. A. et al. Influence of polypropylene microfibre (PPMF) dispersion procedure on fresh and hardened rendering mortar properties. Ambiente Construído , Porto Alegre, v. 20, n. 2, p. 7-23, abr./jun. 2020.
- DANTAS, S. R. A. et al. Influence of the nano TiO2 dispersion procedure on fresh and hardened rendering mortar properties. Construction and Building Materials , v. 215, p. 544-556, 2019a.
- DELHAYE, N.; POITOU, A.; CHAOUCHE, M. Squeeze flow of highly concentrated suspensions of spheres. Journal of Non-Newtonian Fluid Mechanics , v. 94, n. 1, p. 67-74, 2000.
- ENGMANN, J.; SERVAIS, C.; BURBIDGE, A. S. Squeeze flow theory and applications to rheometry: a review. Journal of Non-Newtonian Fluid Mechanics , v. 132, n. 1/3, p. 1-27, 2005.
- EUROPEAN STANDARD. EN 197-1: cement: part 1: composition, specifications, and conformity criteriafor common cement. Brussels, 2000.
- FOLLI, A. et al. Engineering photocatalytic cements: understanding TiO2 surface chemistry to control and modulate photocatalytic performances. Journal of the American Ceramic Society , v.93, p. 3360-3369, 2010.
- HAMIDI, F.; ASLANI, F. TiO2-based photocatalytic cementitious composites: materials, properties, influential parameters, and assessment techniques. Nanomaterials , v. 9, p. 1-33, 2019.
- ISAIA, G. C. (ed.). Materiais de construção civil e princípios de ciência e engenharia de materiais . 3. ed. São Paulo: IBRACON, 2017
- JOSHAGHANI, A. et al. Effects of nano-TiO2, nano-Al2O3, and nano-Fe2O3 on rheology, mechanical and durability properties of self-consolidating concrete (SCC): An experimental study. Construction Building end Materials , v. 245, 2020.
- MACIEL, M. H. et al. Effect of the variation of cement consumption on coating mortars produced based on the concepts of mobility and packaging of particles. Ambiente Construido , Porto Alegre, v.18, n. 1, p. 245-259, jan./mar. 2018.
- MELO, J.V.S; TRICHÊS, G. Study of the influence of nano-TiO2 on the properties of Portland cement concrete for application on road surfaces. Road Materials Pavement Design , v. 19, p. 1011-1026, 2017.
- MIKULÁĔK, P.; WAKEMAN, R. J.; MARCHANT, J. Q. The influence of pH and temperature on the rheology and stability of aqueous titanium dioxide dispersions. Chemical Engineering , v. 67, p. 97-102, 1997.
- OLIVEIRA, I. R. et al. Dispersão e empacotamento de partículas: princípios e aplicações em processamento cerâmico. São Paulo: Fazendo Arte, 2000.
- PARAMÉS, J; BRITO, J. de. Materiais de construção nanotecnológicos de auto-limpeza - Self-cleaning nanotechnologic construction materials. Teoria e Prática na Engenharia Civil , v.15, p. 55-62, 2010.
- SALMAN, M.M.; EWEED, K.M.; HAMEED, A. M. Influence of partial replacement TiO2 nanoparticles on the compressive and flexural strength of ordinary cement mortar. Al-Nahrain Journal for Engineering Sciences , v.19, p. 265-270, 2016.
- SENFF, L. Effect of nanosilica on rheology and fresh properties of cement pastes and mortars. Construction and Building Materials , v. 23, p. 2487-2491, 2009.
- SENFF, L. et al. Effect of nanosilica and microsilica on the microstructure and the hardened properties of cement pastes and mortars. Advanced Applied Ceramics Journal , v. 109, p. 104-110, 2010.
- SENFF, L. et al. Formulation of mortars with nano-SiO2 end nano-TiO2 for degradation of pollutants in buildings. Composites Part B: Engineering , v. 44, n. 1, p. 40-47, 2013.
- SENFF, L. et al. The influence of TiO2 nanoparticles and polyacrylonitrile fibers on the rheological behavior and hardened properties of mortars. Construction and Building Materials , v. 75, p. 315-330, 2015.
- STEFFE, J. F. Rheological methods in food process engineering . 2nd . ed. Michagan: Freeman Press, 1996.
- YANG, L.et al. Efects of nano-TiO2 on strength, shrinkage and microstructure of alkali activated slag pastes. Cement and Concrete Composites , v. 57, p. 1-7, 2015.
Publication Dates
-
Publication in this collection
02 Aug 2021 -
Date of issue
Oct-Dec 2021
History
-
Received
28 July 2020 -
Accepted
24 Feb 2021

 Source: adapted from

 Source: adapted from